Article category: Science & Technology, Climate Solutions
Measuring Volcanic Earth Displacement Using Interferometric...
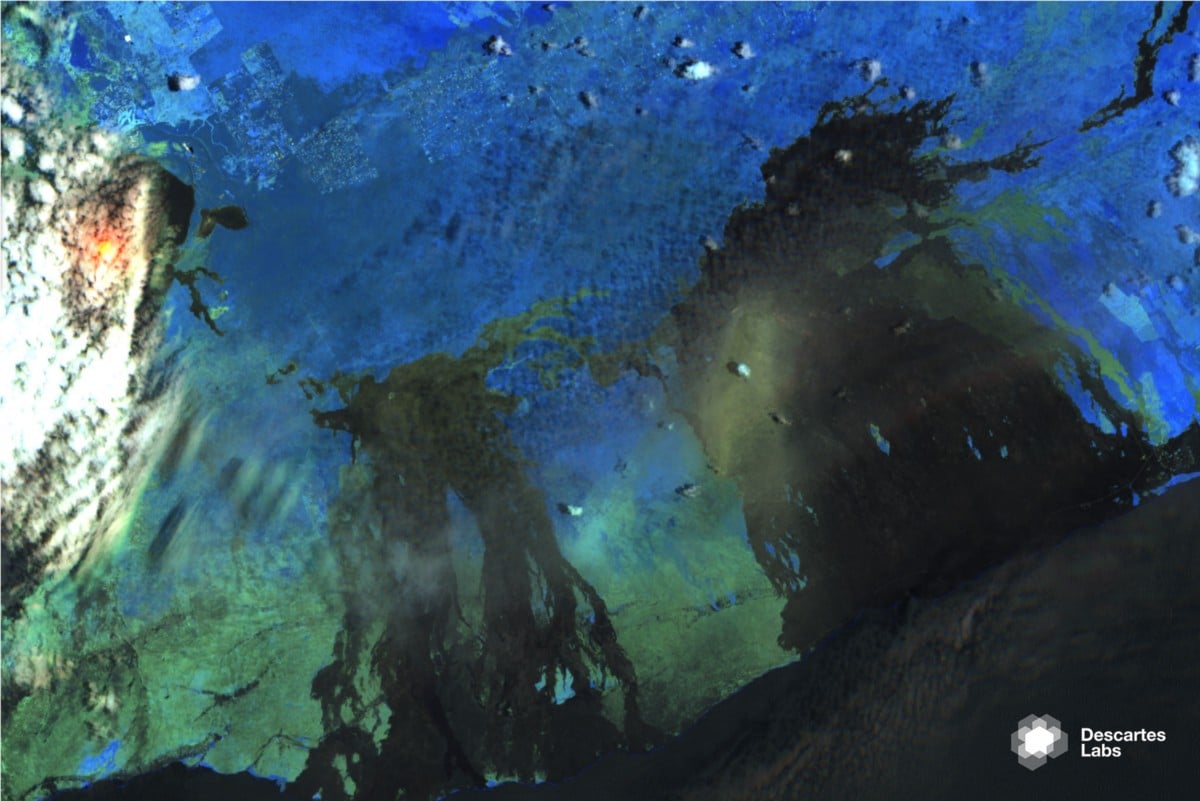
Figure 1: An interferogram from a pair of collections made during descending passes. The fringes to...
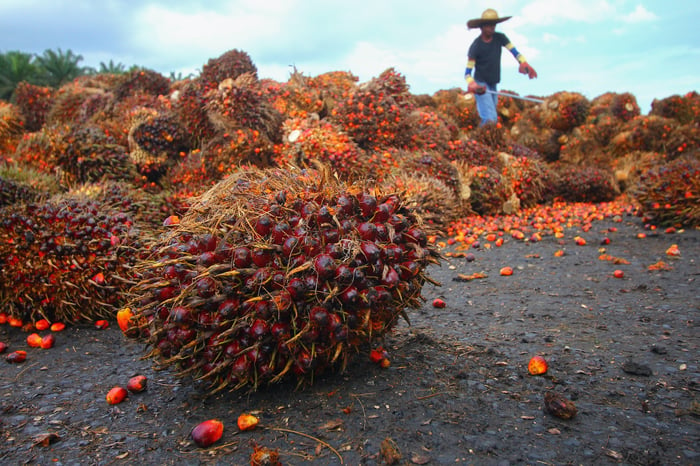
According to the World Wildlife Federation, palm oil can be found in almost 50% of all packaged supermarket goods. As demand continues to increase, global agriculture and manufacturing companies are searching for ways to determine risk factors for deforestation and carbon emissions in the palm supply chain. Adding risk factors and associated traceability can help verify sustainable sourcing commitments and provide tools to help non-compliant participants to adopt more sustainable practices.
While there is some sourcing transparency from mills to manufacturers, a high number of third-party growers supply to these mills, comprising a challenge for NDPE compliance. Therefore, companies need to understand probable source locations, land-use histories, and aggregate sourcing practices for each mill in their supply chain. They also need to attribute ongoing deforestation activity to a given mill and supplier.
However, there is currently no widely available information that traces palm throughout the supply chain. And there is no direct way of attributing palm harvested within a plantation to the mill that eventually processes it. Further, concession ownership and permits have little transparency, making it challenging to attribute deforestation to specific growers. Still, there are a few factors that bound the sourcing region for a given palm mill (e.g. distance, transportation network, mill capacity, nearby mill capacity, etc.), that could allow us to estimate the probability and risk of a given mill processing palm from a given plantation.

This post explores a relatively simple method to attribute risk from deforestation and forest carbon loss to individual mills throughout the palm supply chain in Southeast Asia. It applies deforestation and carbon loss risk scores to the entire Universal Mill List maintained by the World Resources Institute (WRI), Rainforest Alliance (RA), Proforest, and Daemeter Consulting.
Our analysis leverages some key datasets and the compute power of the Descartes Labs Platform. The creation of these datasets in a singular development environment natively allows for the prediction of carbon equivalent of deforestation events. Each has been built with the other in mind.
First, we show how the methodology works for a given mill. Then we replicate the methodology over every mill in the Universal Mill List. We start by drawing a radius around each mill, quantifying the deforested area and forest carbon lost within the region over a set period of time, and then normalize by the total forest area and forest carbon.
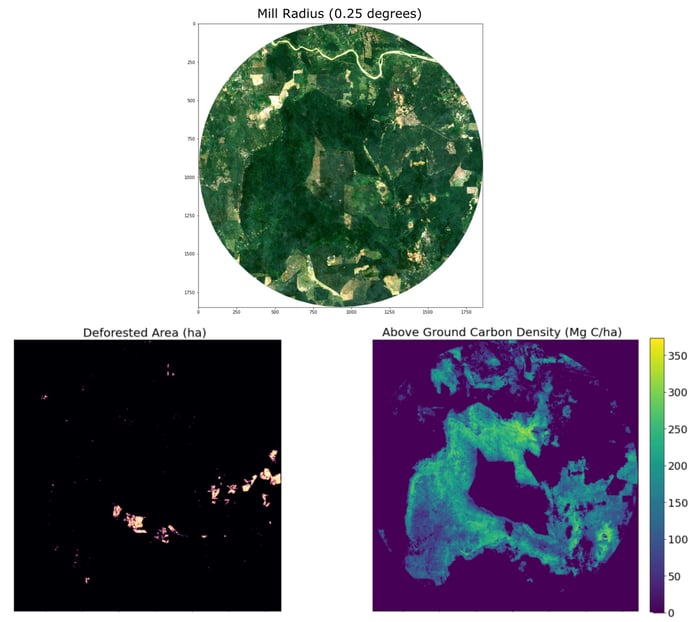
We also create a weighted average over the mill area using inverse distance such that deforested pixels closer to the mill are weighed more than those found farther from the mill.

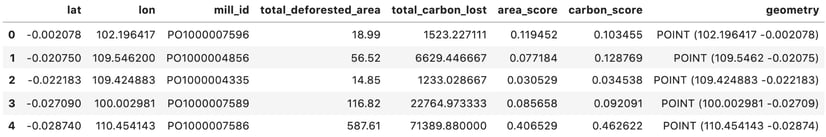
Once we have our totals and our distance weights, we can calculate a deforested area score and carbon loss score for the mill in question. Scores generally range between 0 and 4, with higher scores indicating higher risk
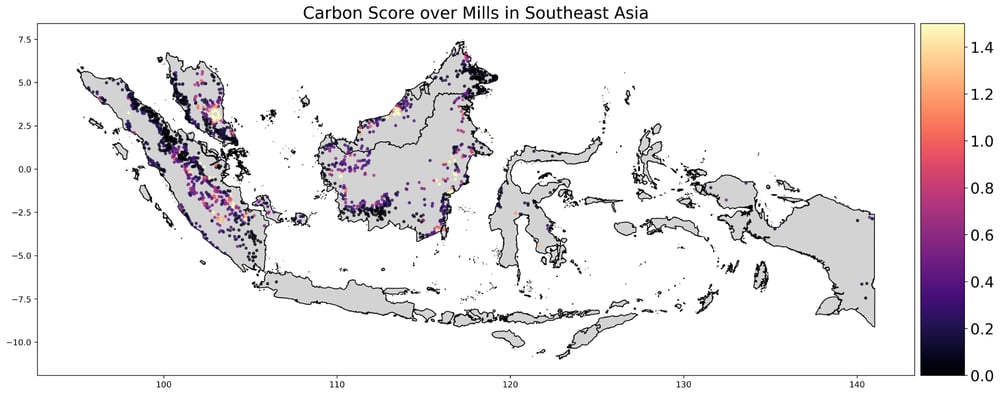
Next, we use the Descartes Labs Platform to apply the same methodology to the Universal Mill List within Indonesia and Malaysia.
Finally, we can visualize it all together using Descartes Labs Workflows API.

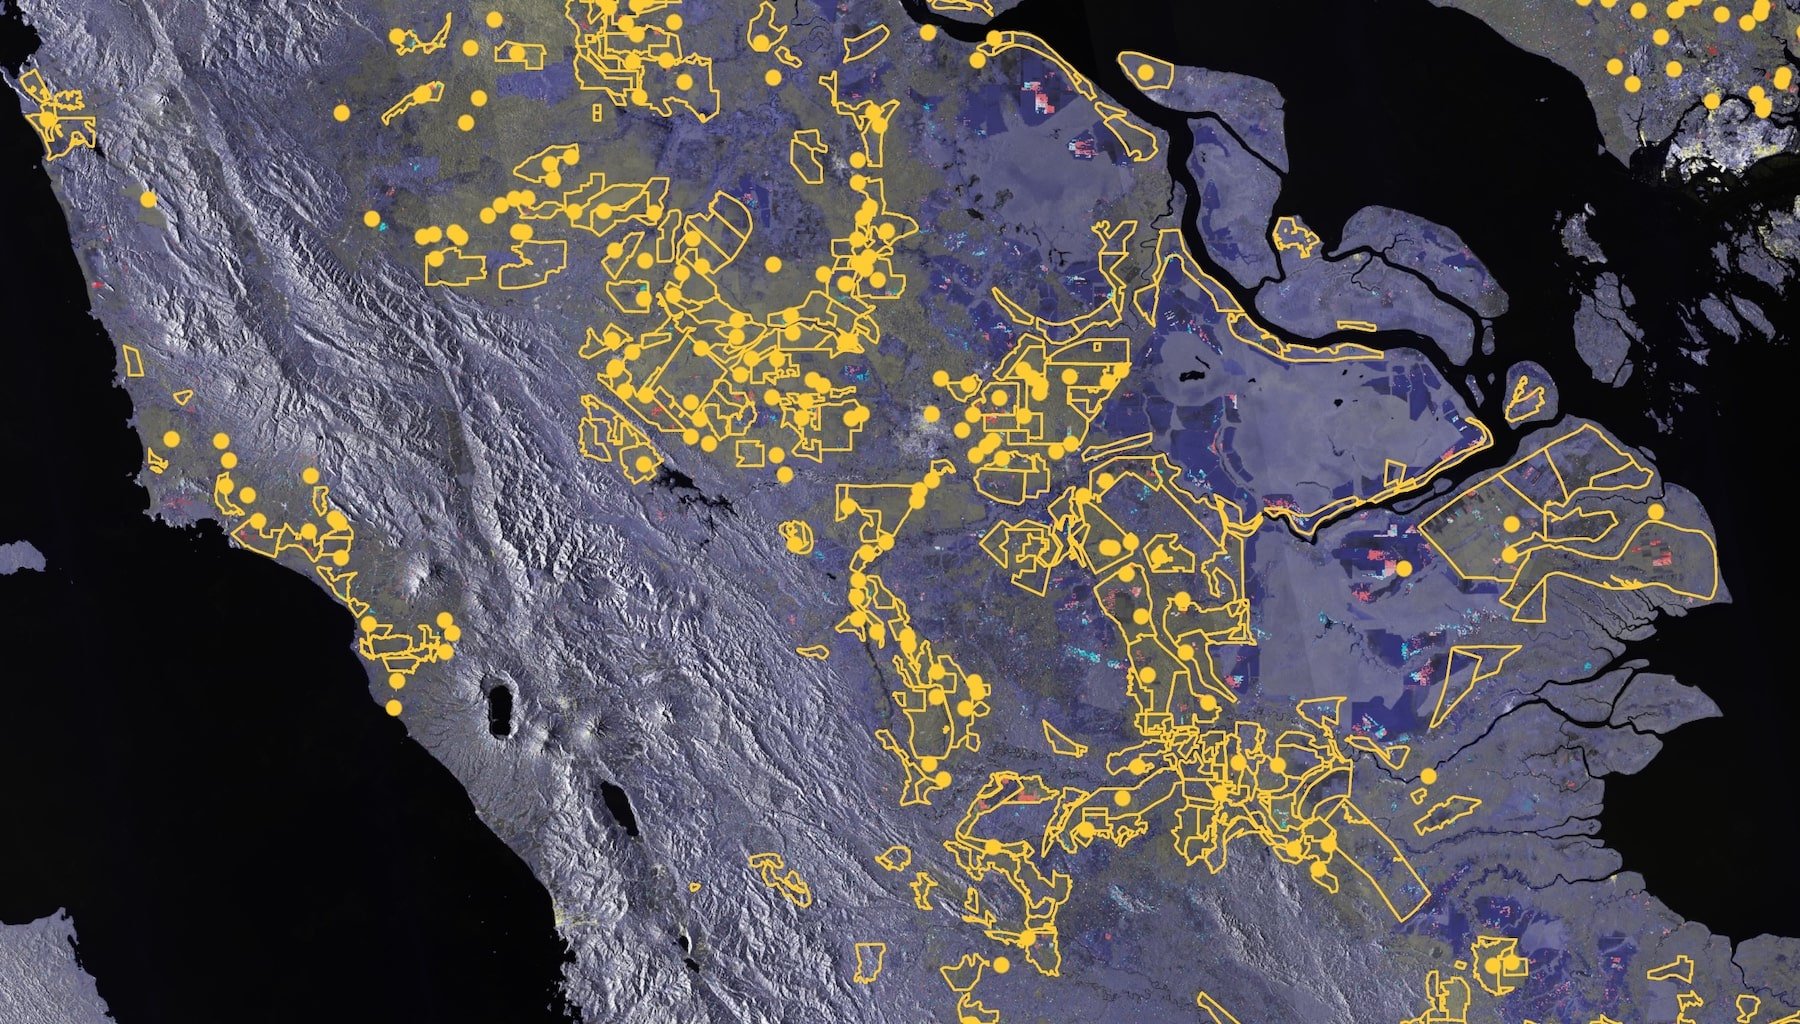
When we zoom in on a particular location, we see the layers for each dataset along with the deforested area and carbon scores for nearby mills. Note that the size of the buffer around each mill has been reduced to prevent overlap during visualization.
Now that the dataset has been created, it can be used to inform supply chain risk assessment for any company that sources from the Universal Mill List. To summarize, we built a mill-level deforestation & carbon emissions risk score across Malaysia and Indonesia. To do this, we leveraged proprietary Descartes Labs datasets to determine historical deforestation activity and carbon loss potential based on a distance-weighted formula to each mill. This produces a dataset that allows mills to be ranked by deforested area score and carbon loss score to determine focus areas for ongoing sustainability decisions.