Article category: Consumer Goods, Climate Solutions
Calculating Mill Level Deforestation & Carbon Risk Scores...
Learn how we leverage key datasets from the Descartes Labs Platform to attribute risk from...
Zhihan Ma, Global Head of ESG at AllianceBernstein speaks with Erika Randolph, Director of Sustainability at Descartes Labs, on how geospatial data can be a powerful tool to combat deforestation and biodiversity loss during the AllianceBernstein ESG Conference on Biodiversity earlier this year. Read the transcript of Erika's presentation below. The full conference transcript can be accessed here.
Zhihan Ma: Leveraging geospatial imaging and satellite data are other potential enabling technologies to track deforestation and biodiversity loss. Such technologies not only have the potential to measure progress but also hold companies accountable for their commitments. I'll now turn it over to Erika Randolph at Descartes Labs to discuss these innovative ideas in more detail.
Erika Randolph: We've talked about the global challenges brought about by the agricultural system thus far, and today I'll share how Descartes Labs uses remote sensing, machine learning, and cloud computing to help commodity intensive companies address sustainability and biodiversity in their supply chains.
Descartes labs is a geospatial intelligence company with science and technology at our core, launched out of Los Alamos National Labs in 2014. We build models of the earth that power the analysis of the world's largest physical systems. We serve large consumer products, agriculture, mining companies, and the Department of Defense by enabling them to harness the power of geospatial analytics to better understand and reduce their impact on the physical world.
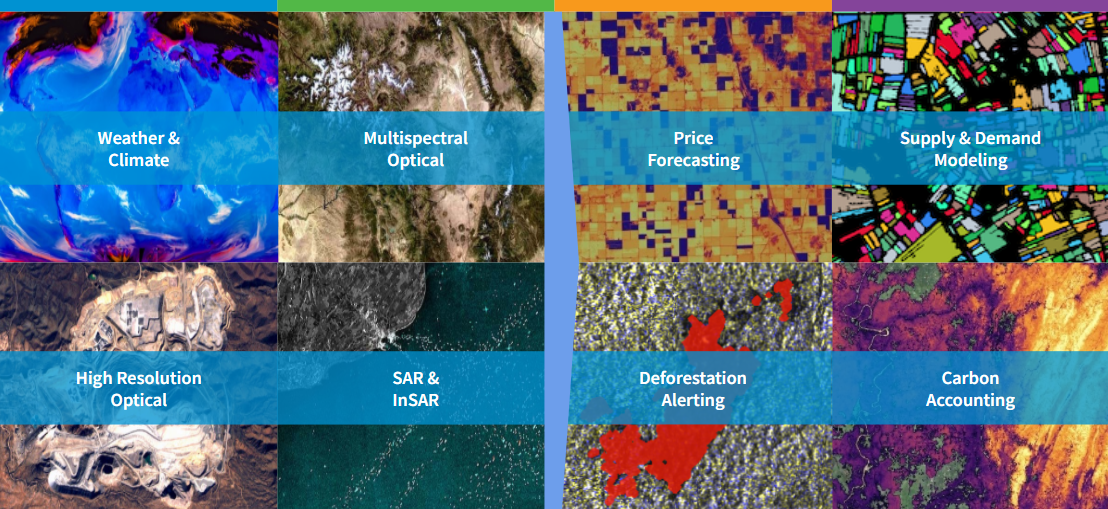
We believe that ESG can go hand-in-hand with enhanced operational performance by leveraging data. Our approach combines diverse datasets that are continuously updated and co-registered by location and time to fuel a variety of applications and measure critical supply chain factors that are otherwise difficult to quantify.
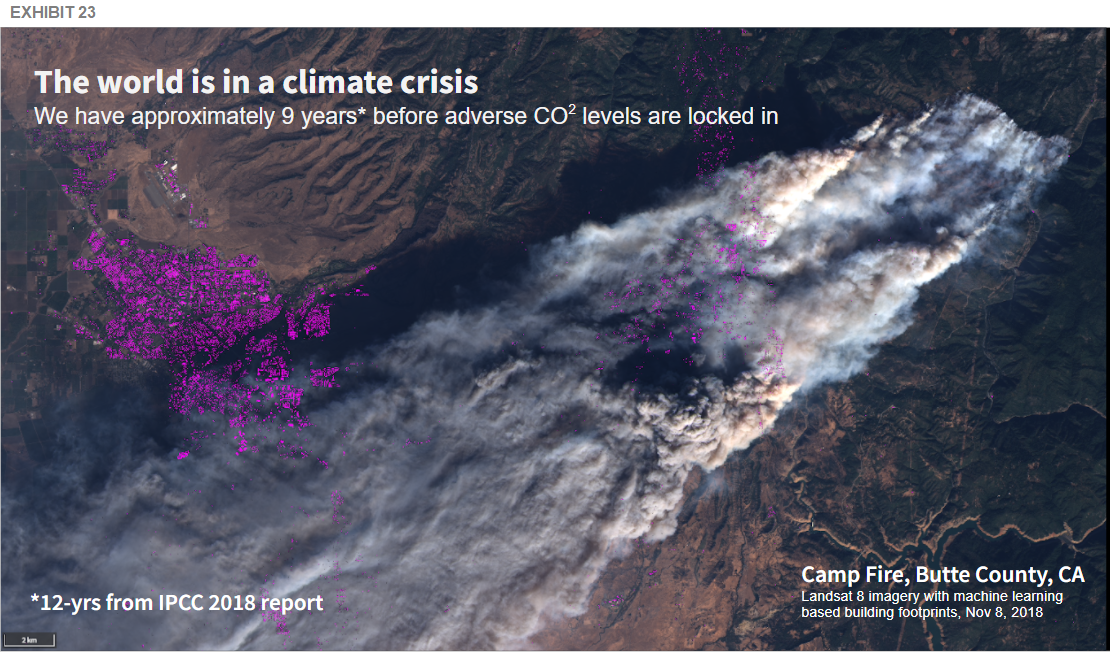
Erika Randolph: We have elected to apply our technology to some of the world's most challenging and urgent problems, namely the climate crisis. Exhibit 23 shows an image of the Camp Fire, and the purple captures the buildings in direct proximity to the burn using remote sensing and machine learning.
The spirit of today's focus is on biodiversity, and I will discuss how Descartes Labs leverages our technology to end deforestation in commodity supply chains.
We've heard some great facts shared by the previous speakers, and know that four commodity products (beef, palm, soy, and wood) drive the majority of deforestation globally. These products cause devastation to biodiversity and greatly reduce the carbon carrying capacity of large areas of land which help limit rising temperatures. Margaret previously mentioned an interesting fact that land conversion from agriculture accounts for 70% of biodiversity loss.
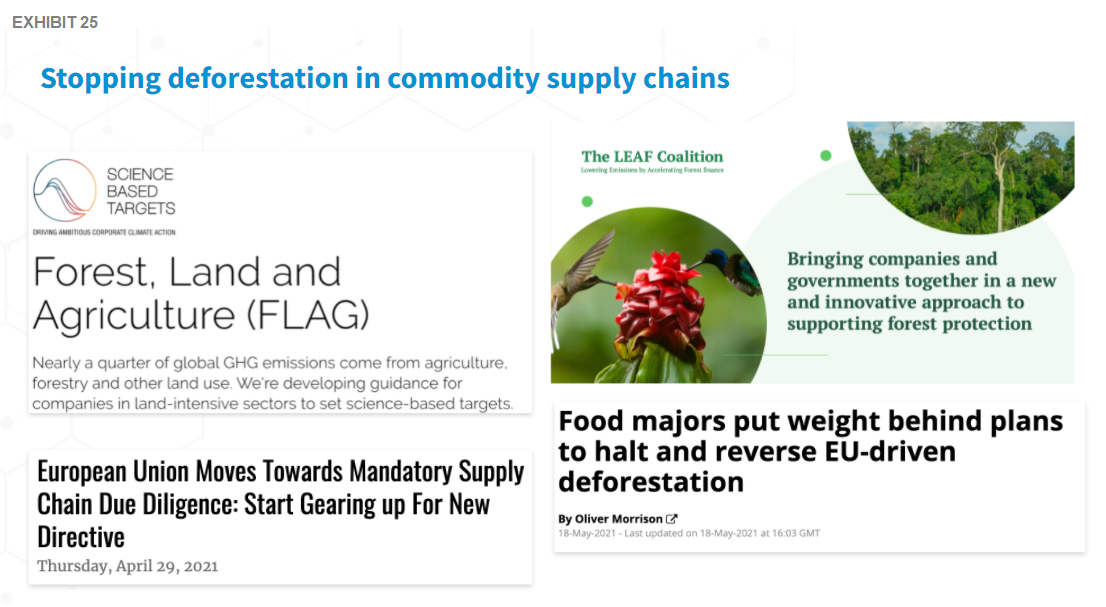
Erika Randolph: Many companies have made (and missed) their deforestation reduction commitments. There's a growing number of discussions in the voluntary standards and regulatory space around quantifying deforestation in science-based targets and emissions reporting.
Recently, we saw that Amazon, among other companies and in combination with major governments and non-profits announced the LEAF coalition, which is a global effort to end deforestation by 2030. However, the question remains in terms of what we need to measure progress against targets.
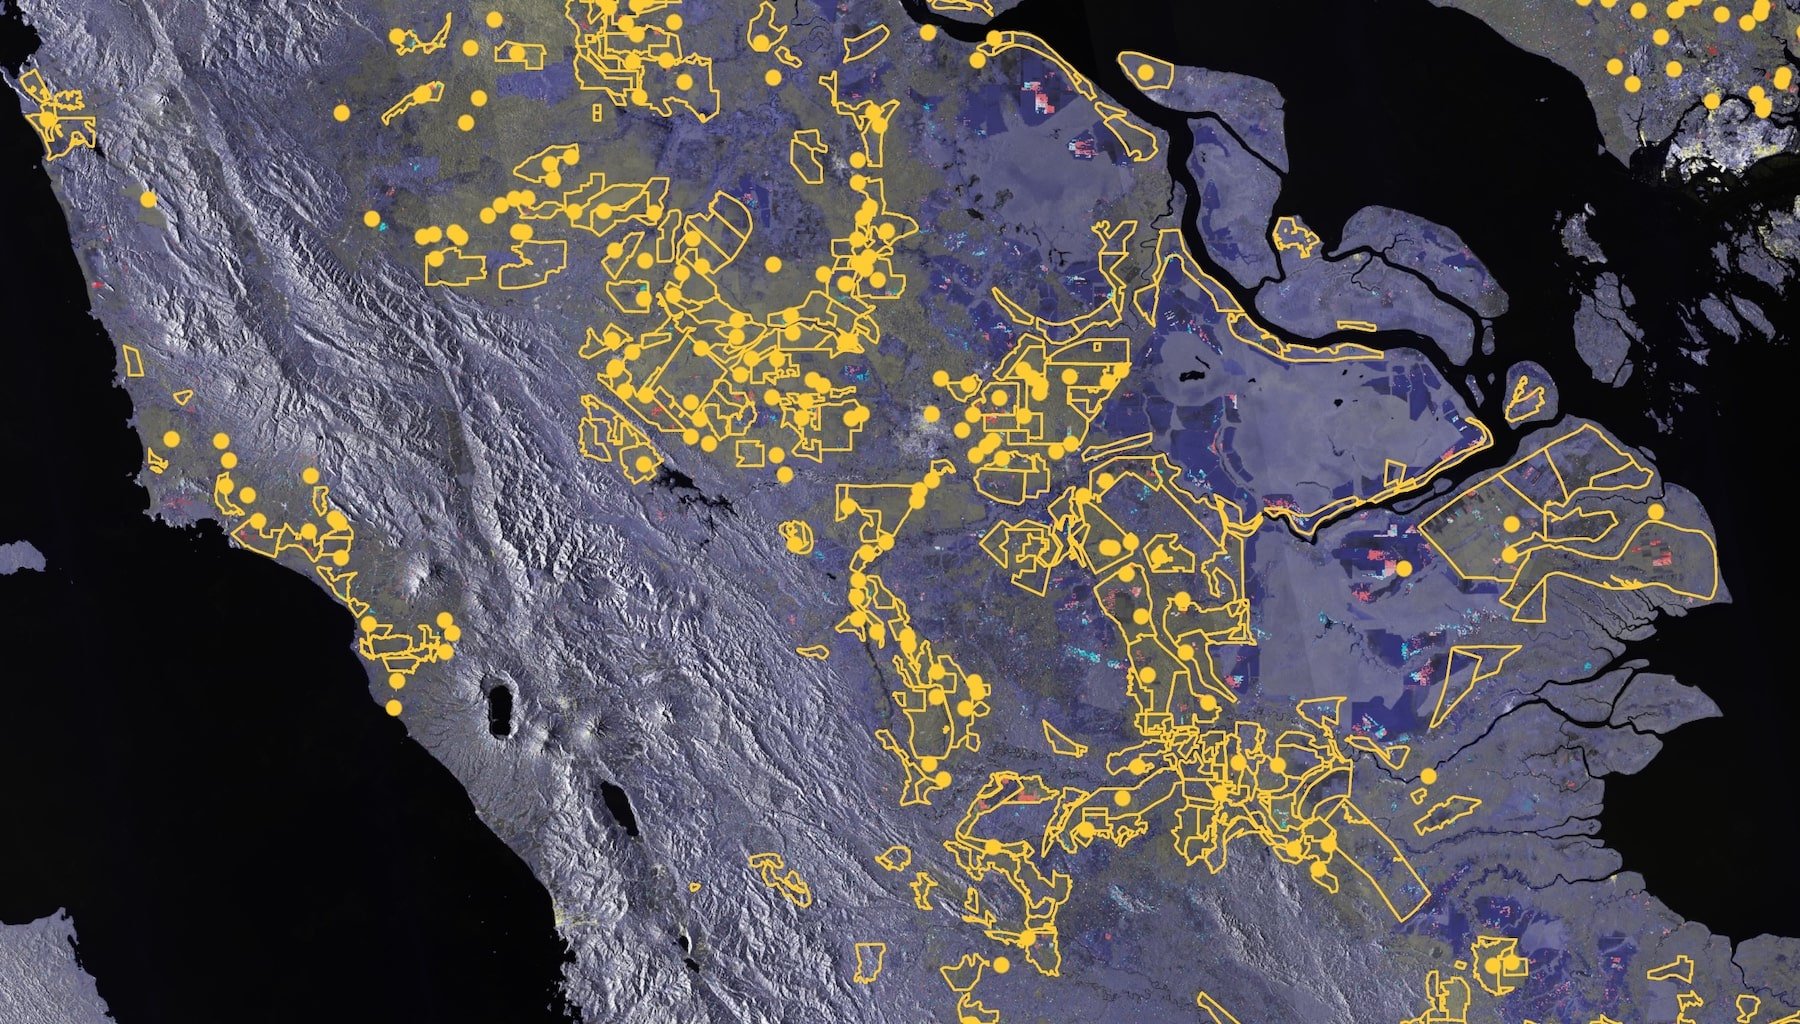
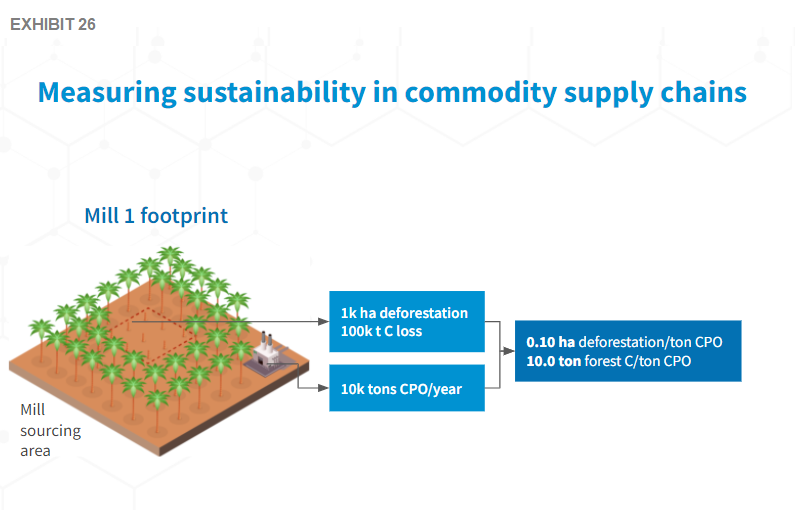
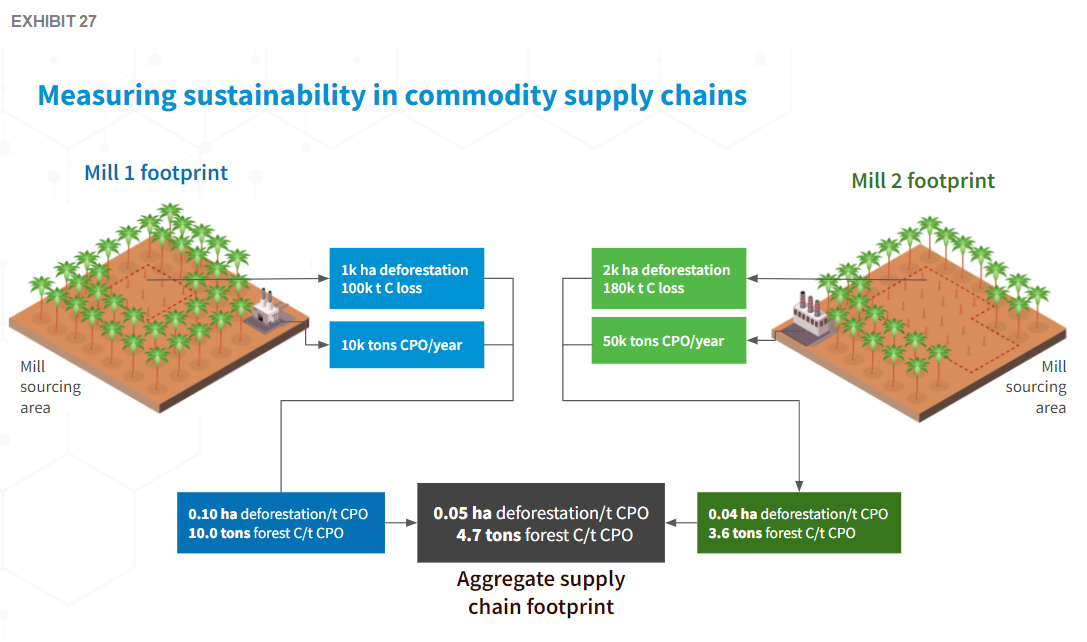
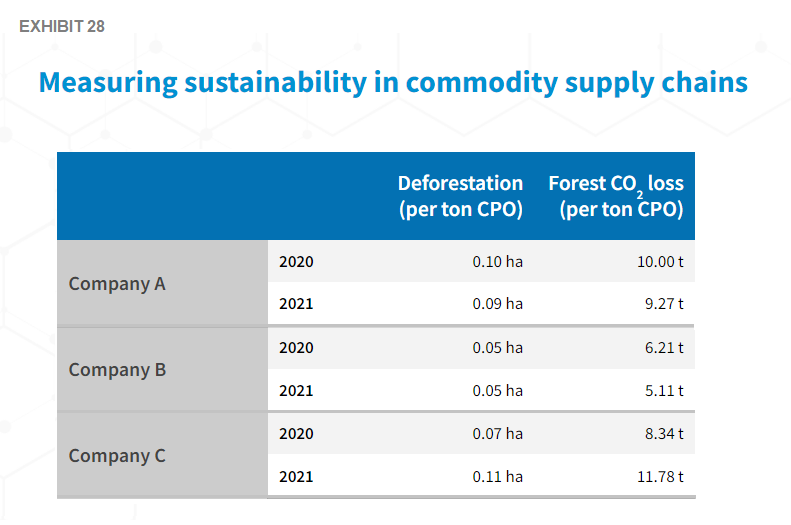
Erika Randolph: A critical component of addressing deforestation is transparent accounting of the land intensity of agricultural production. This accounting captures deforestation, as well as the carbon emissions impact of production, and attributes the data to specific companies and supply chains.
Erika Randolph: The question remains of how to achieve this idea as it is impossible to manage what isn't measured. There are five critical components that are necessary in implementing reporting and accounting. Four of these components are well developed and for the fifth, I'm looking forward to our next speaker.
The five steps are:
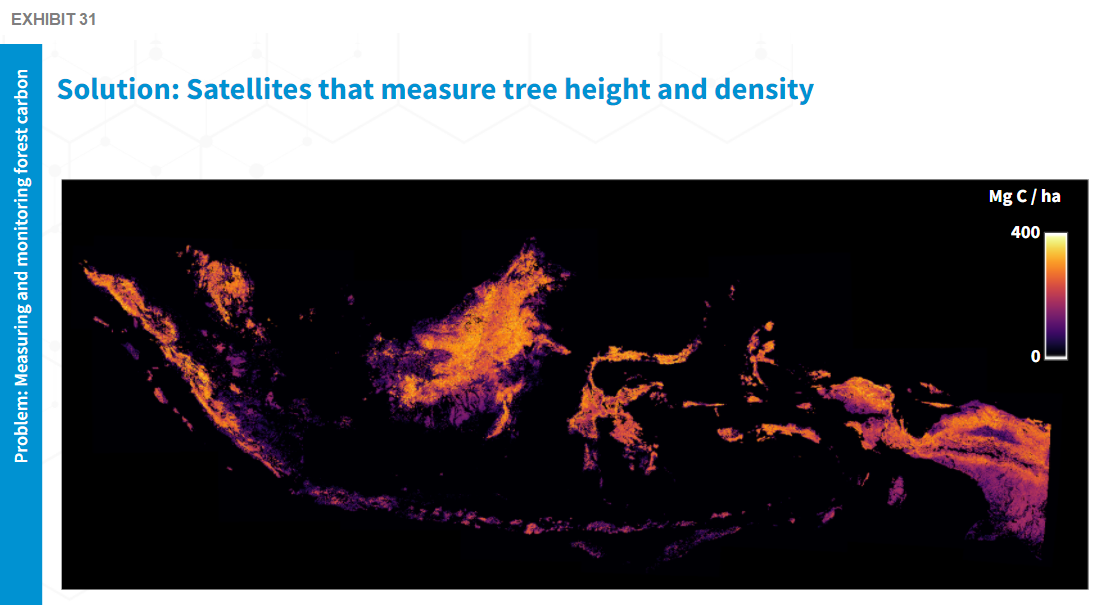
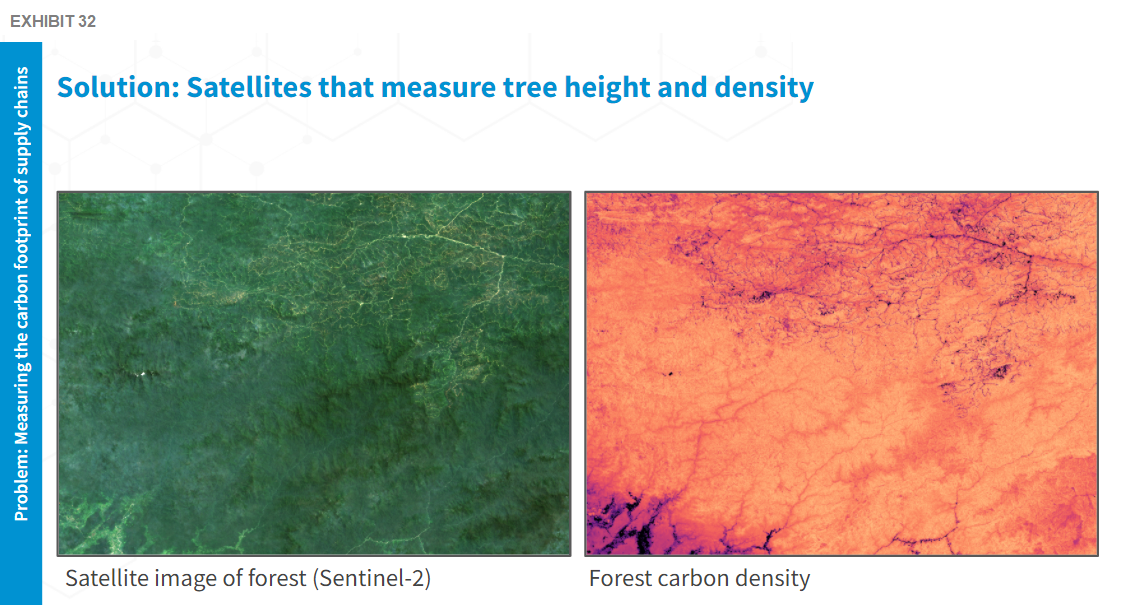
Erika Randolph: The first step is measuring carbon forest accurately. We view satellites with the capability to measure tree height and density as a solution to addressing this challenge.
There is an array of commercial and publicly available instruments in orbit that provide insight into tree height and density. The data is incredibly large and difficult to process, requiring architecture like that of Descartes Labs to enable efficient and analysis-ready data. Descartes Labs leverages data from the GEDI sensor (on the left of Exhibit 30) on the International Space Station to create wall-to-wall estimates of the above ground biomass carbon over the world's tropical forests.
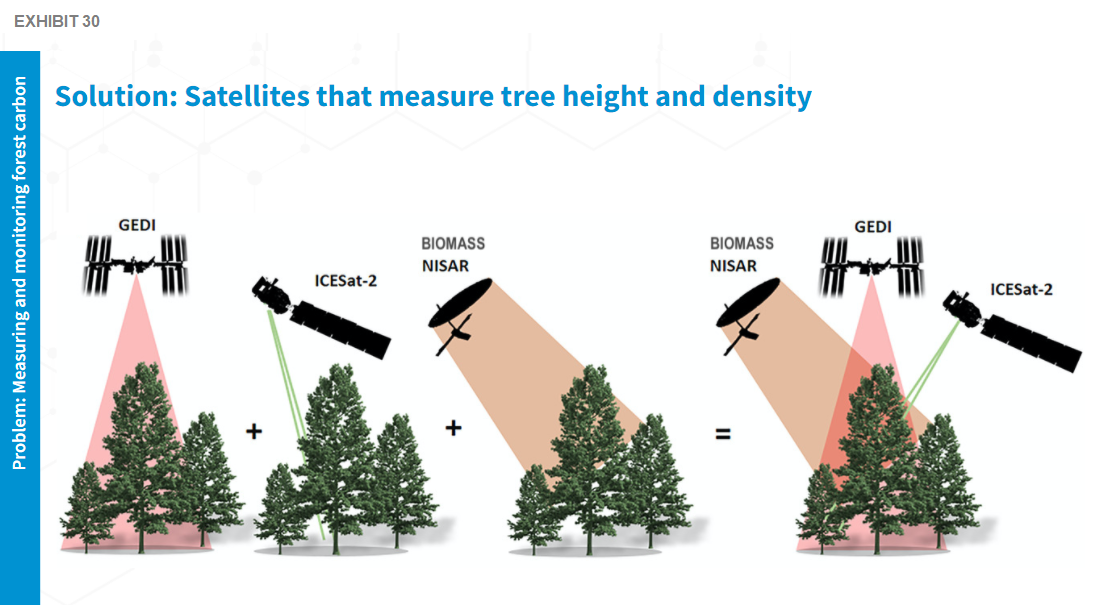
Erika Randolph: The next challenge is measuring forest degradation. There have been various efforts in place from optical-based systems to the current world of radar-based solutions.
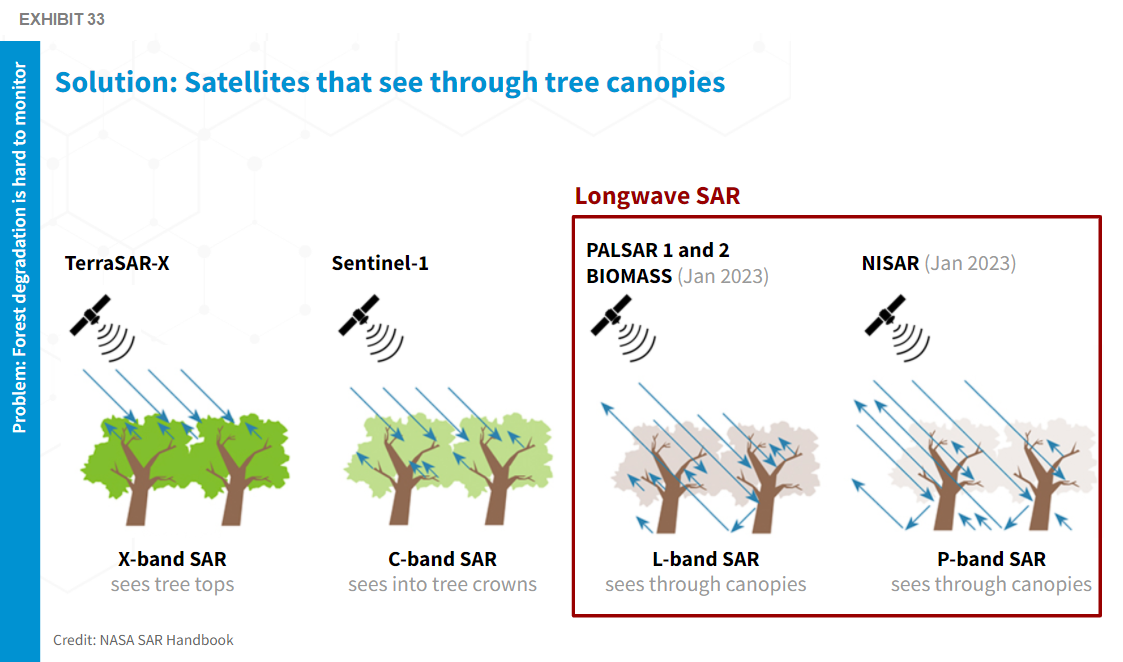
The right showcases a whole class of instruments designed specifically to monitor changes below the tree canopy. We have the PALSAR satellites from the Japanese Space Agency as well as two new instruments expected to launch in 2023 that will provide openly available and ongoing monitoring of forest biomass and degradation everywhere in the world. This development is exciting as we've been waiting for data like this to become publicly available for years.
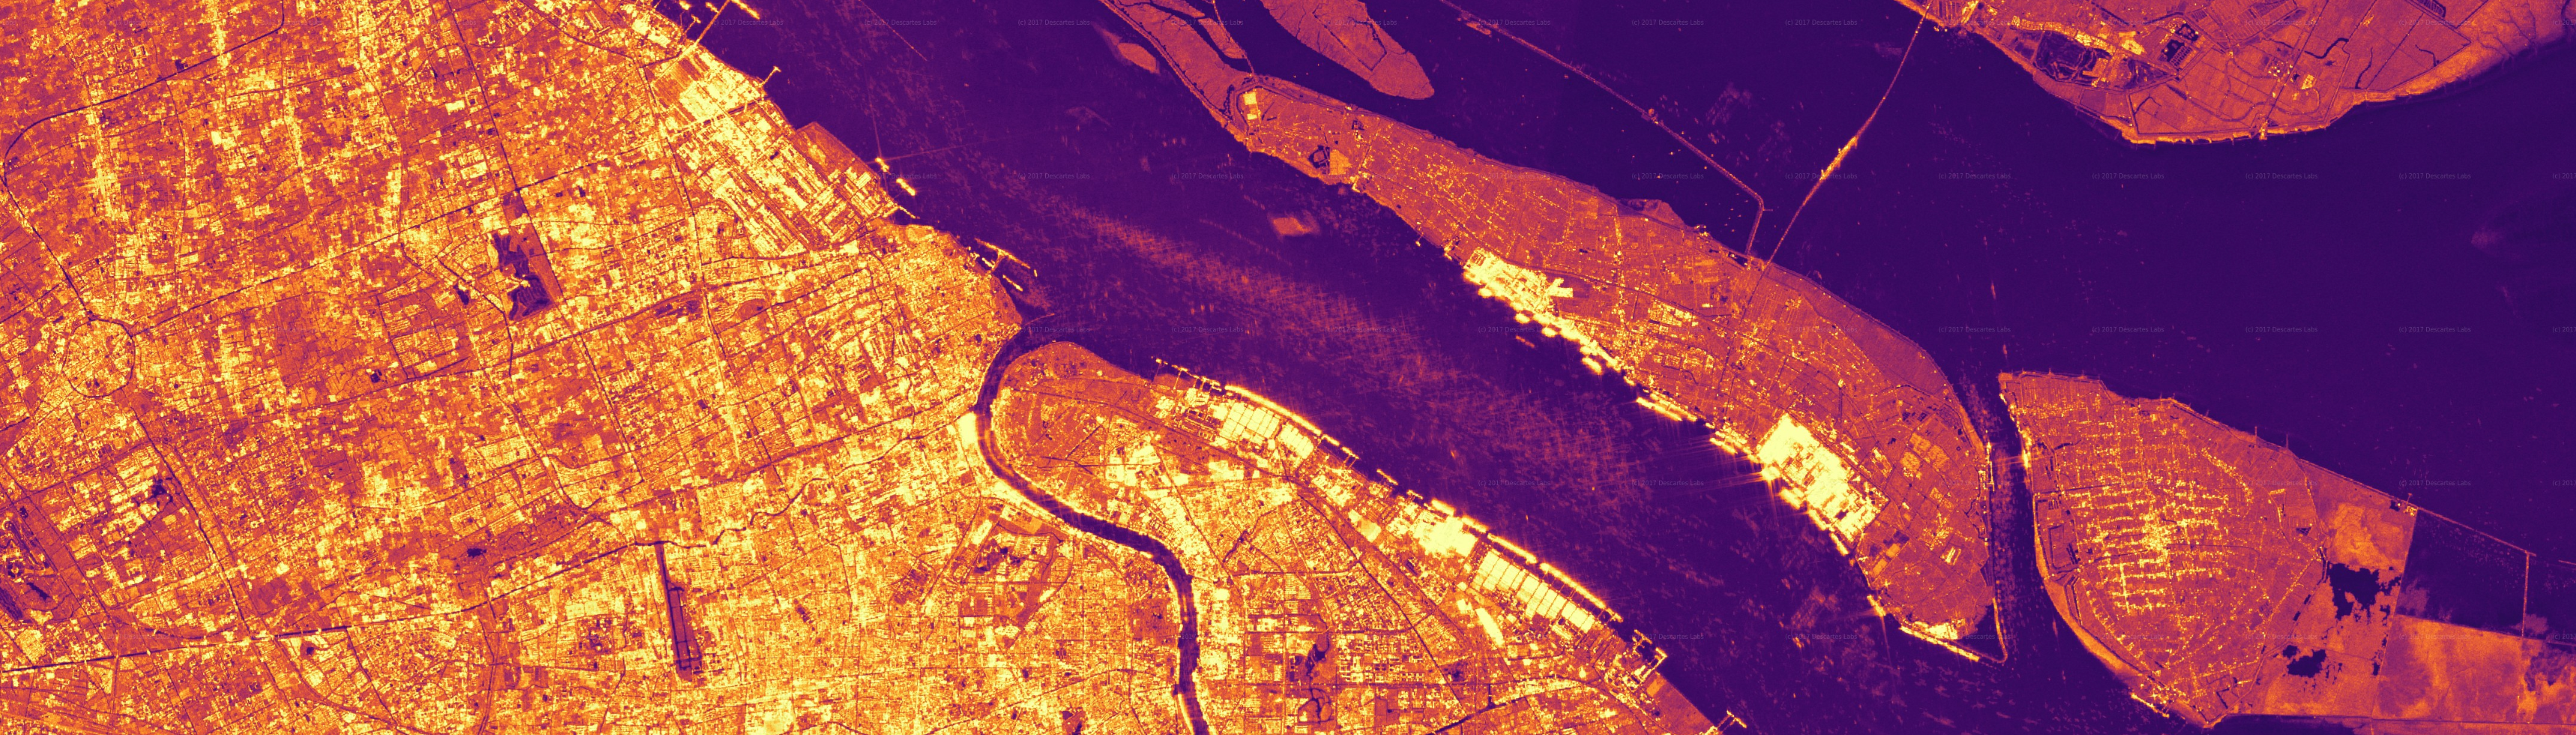
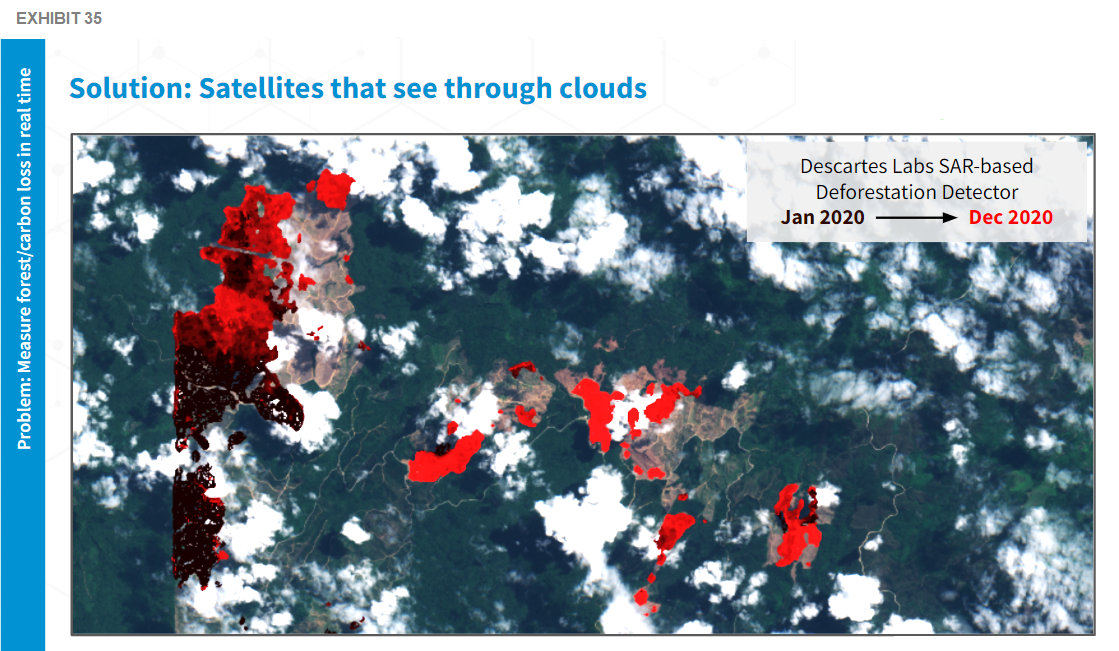
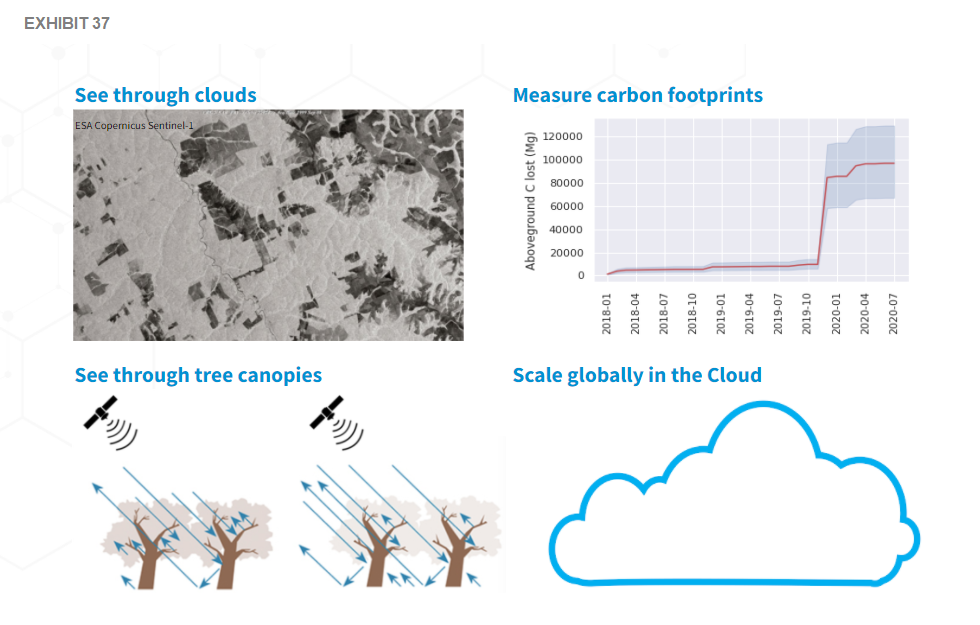
Erika Randolph: The next problem tackles measuring forest loss and carbon loss in real time, and the solution is satellites that see through clouds.
Exhibit 34 provides an example of the challenges we face by solely relying on optical imagery. These are both images over the same area of forested land in Sumatra. The left shows an image from November 2019 where initial forest clearing has occurred. On the right, you can see the next available optical image that has few enough clouds to act on this information. This image was taken six months later and shows a significant amount of deforestation and land clearing that occurred in this time.
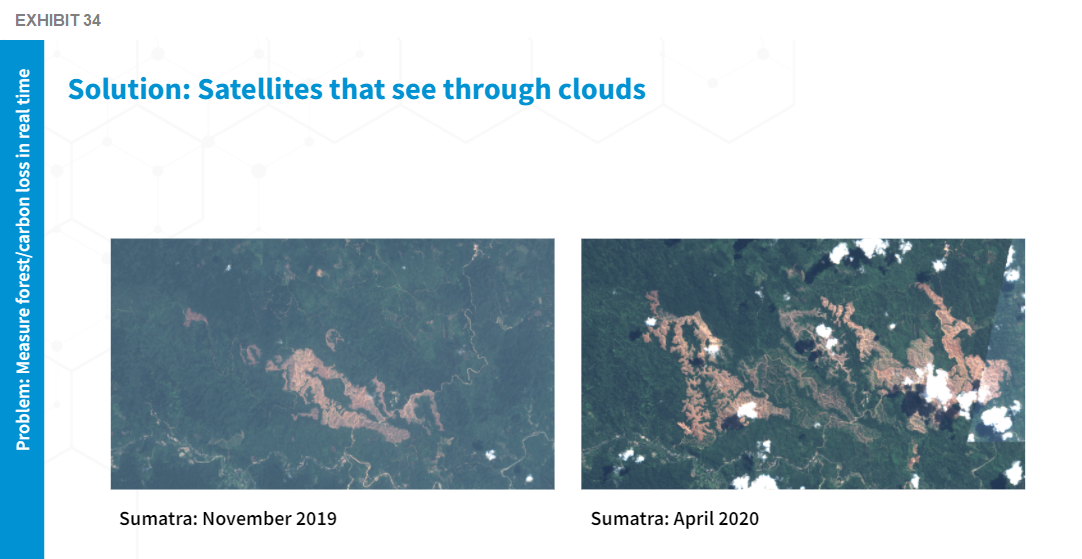
This tells us that the cloud cover in tropical regions of the world prevents optical visibility to massive devastating events on an actionable timescale.
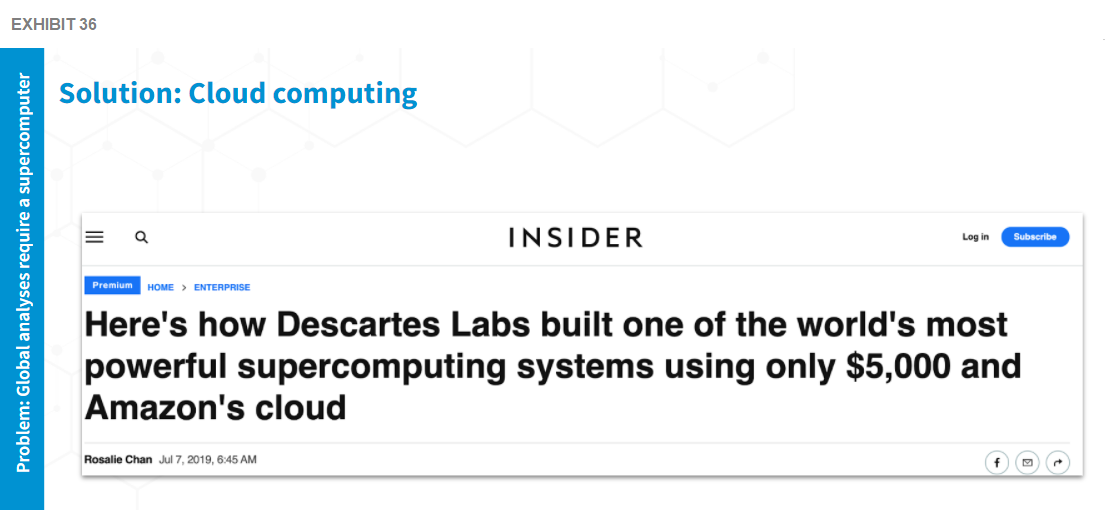
Erika Randolph: The next challenge is that deploying these technologies at a global scale requires the ability to compute at a global scale. Our most recent top 500 run on AWS puts us as the #40 fastest supercomputer in the world. We've improved our performance by 417% and in a two-year period we were able to outperform gains from traditional on-premise computers by a factor of 10. The growth in cloud computing, which we're seeing across the board, enables the ability to efficiently deploy at a global scale.
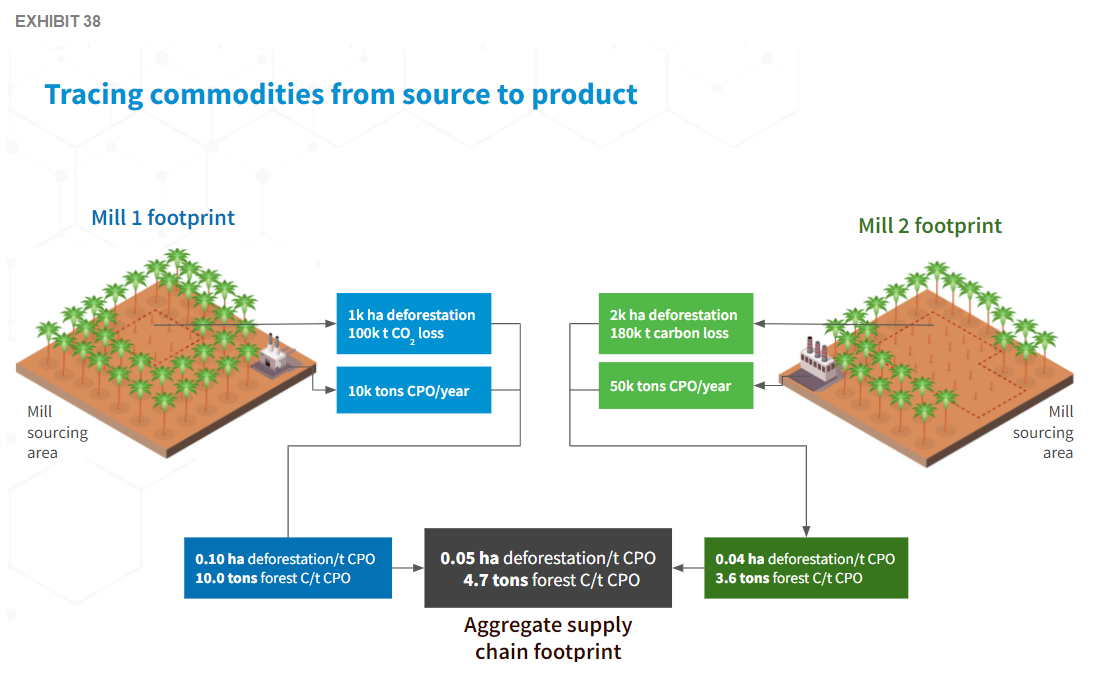
Erika Randolph: What's missing from this [illustrated] equation is the ability to accurately trace these commodities from source to product. Many of the companies we work with on monitoring and reducing deforestation in their supply chain have a moderate understanding of the full range of entities and supply chain nodes involved in getting a product from the source to their final product. Therefore, we need to discuss technologies that enable closing this last piece of the puzzle.
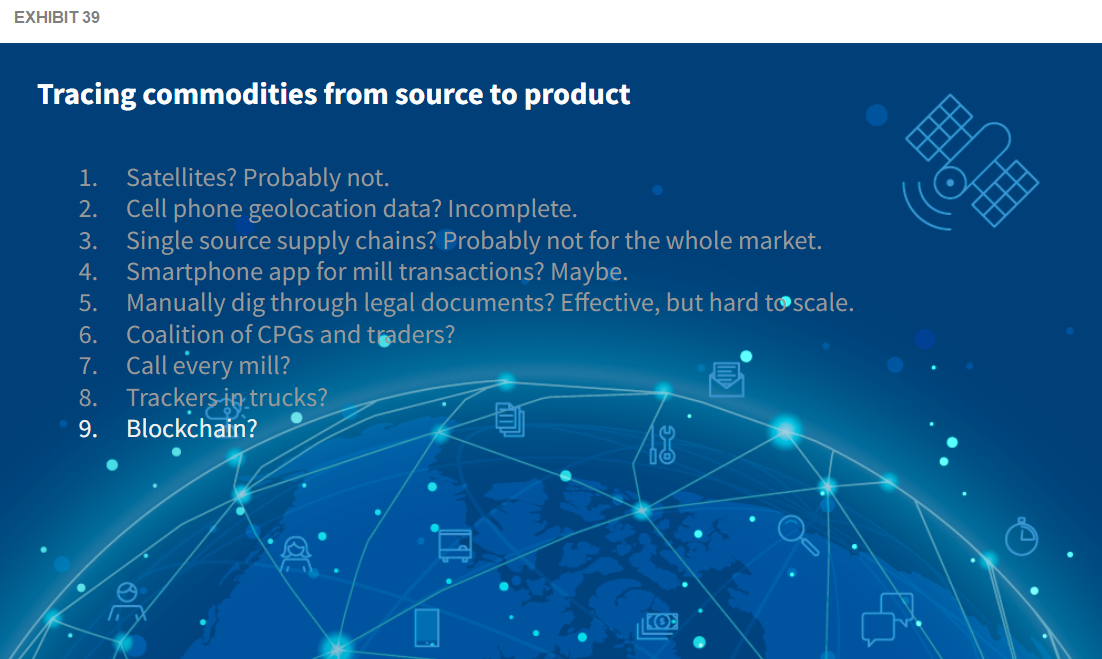
Erika Randolph: Here are some examples of a number of technologies that have been tested or are being tested to enable us to trace commodities from source to product.
Satellites don't have the granularity to enable us to do this. We've also worked with cell phone geo-location, but it lacks sufficient coverage in many parts of the world to obtain a complete picture. A lot of these possibilities have been tested or are in progress and I put forward the challenge to this group in this audience as this is a problem that we can solve together.
I'll leave you with these ideas as food for thought and a lead into our next discussion, which is focused on blockchain for supply chain traceability.
Zhihan Ma: Thank you so much Erika. That's a great segue to the last section of the discussion, but before I move over to Sai about blockchain applications, Erika could you talk about some other use cases of geospatial imaging? For example, does it work on tracking overfishing and are there other types of nature-based impacts that we can track?
Erika Randolph: The applications for geospatial imagery and remote sensing are vast. Descartes labs focuses our efforts on enabling better supply chain sustainability decisions by companies in commodity supply chains. I've discussed an example of monitoring existing events and what it will take to actually impact deforestation or overfishing. In the future, we will be able to leverage remote sensing combined with machine learning to create predictive models that understand when environmentally destructive activities will occur. We can assess the signature of the likely lead up to a deforestation event and create a predictive model.
Similarly, for overfishing or illegal fishing we can use remote sensing to understand the signatures of what is considered normal behavior versus what is considered illicit behavior. The information can be supplied to governments or other entities involved in the space to prevent the occurrence of these types of events, rather than responding to them after the fact.
Zhihan Ma: That all sounds very exciting and we look forward to it. Thank you, Erika.
Contact us to learn how geospatial intelligence can help you reach your business goals.