Article category: Science & Technology
Fast and interactive deployment of computer vision models...
Leveraging satellite imagery for machine learning computer vision applications using the Descartes...
Technology Overview: At the core of Descartes Labs’ technology is a powerful end-to-end geospatial modeling platform. This blog post focuses on the Batch Compute service, which enables users to quickly deploy complex analysis on hundreds of nodes with just two lines of code. Descartes Labs’ robust suite of tools allows users to easily create, manage, and monitor large-scale computing pipelines.
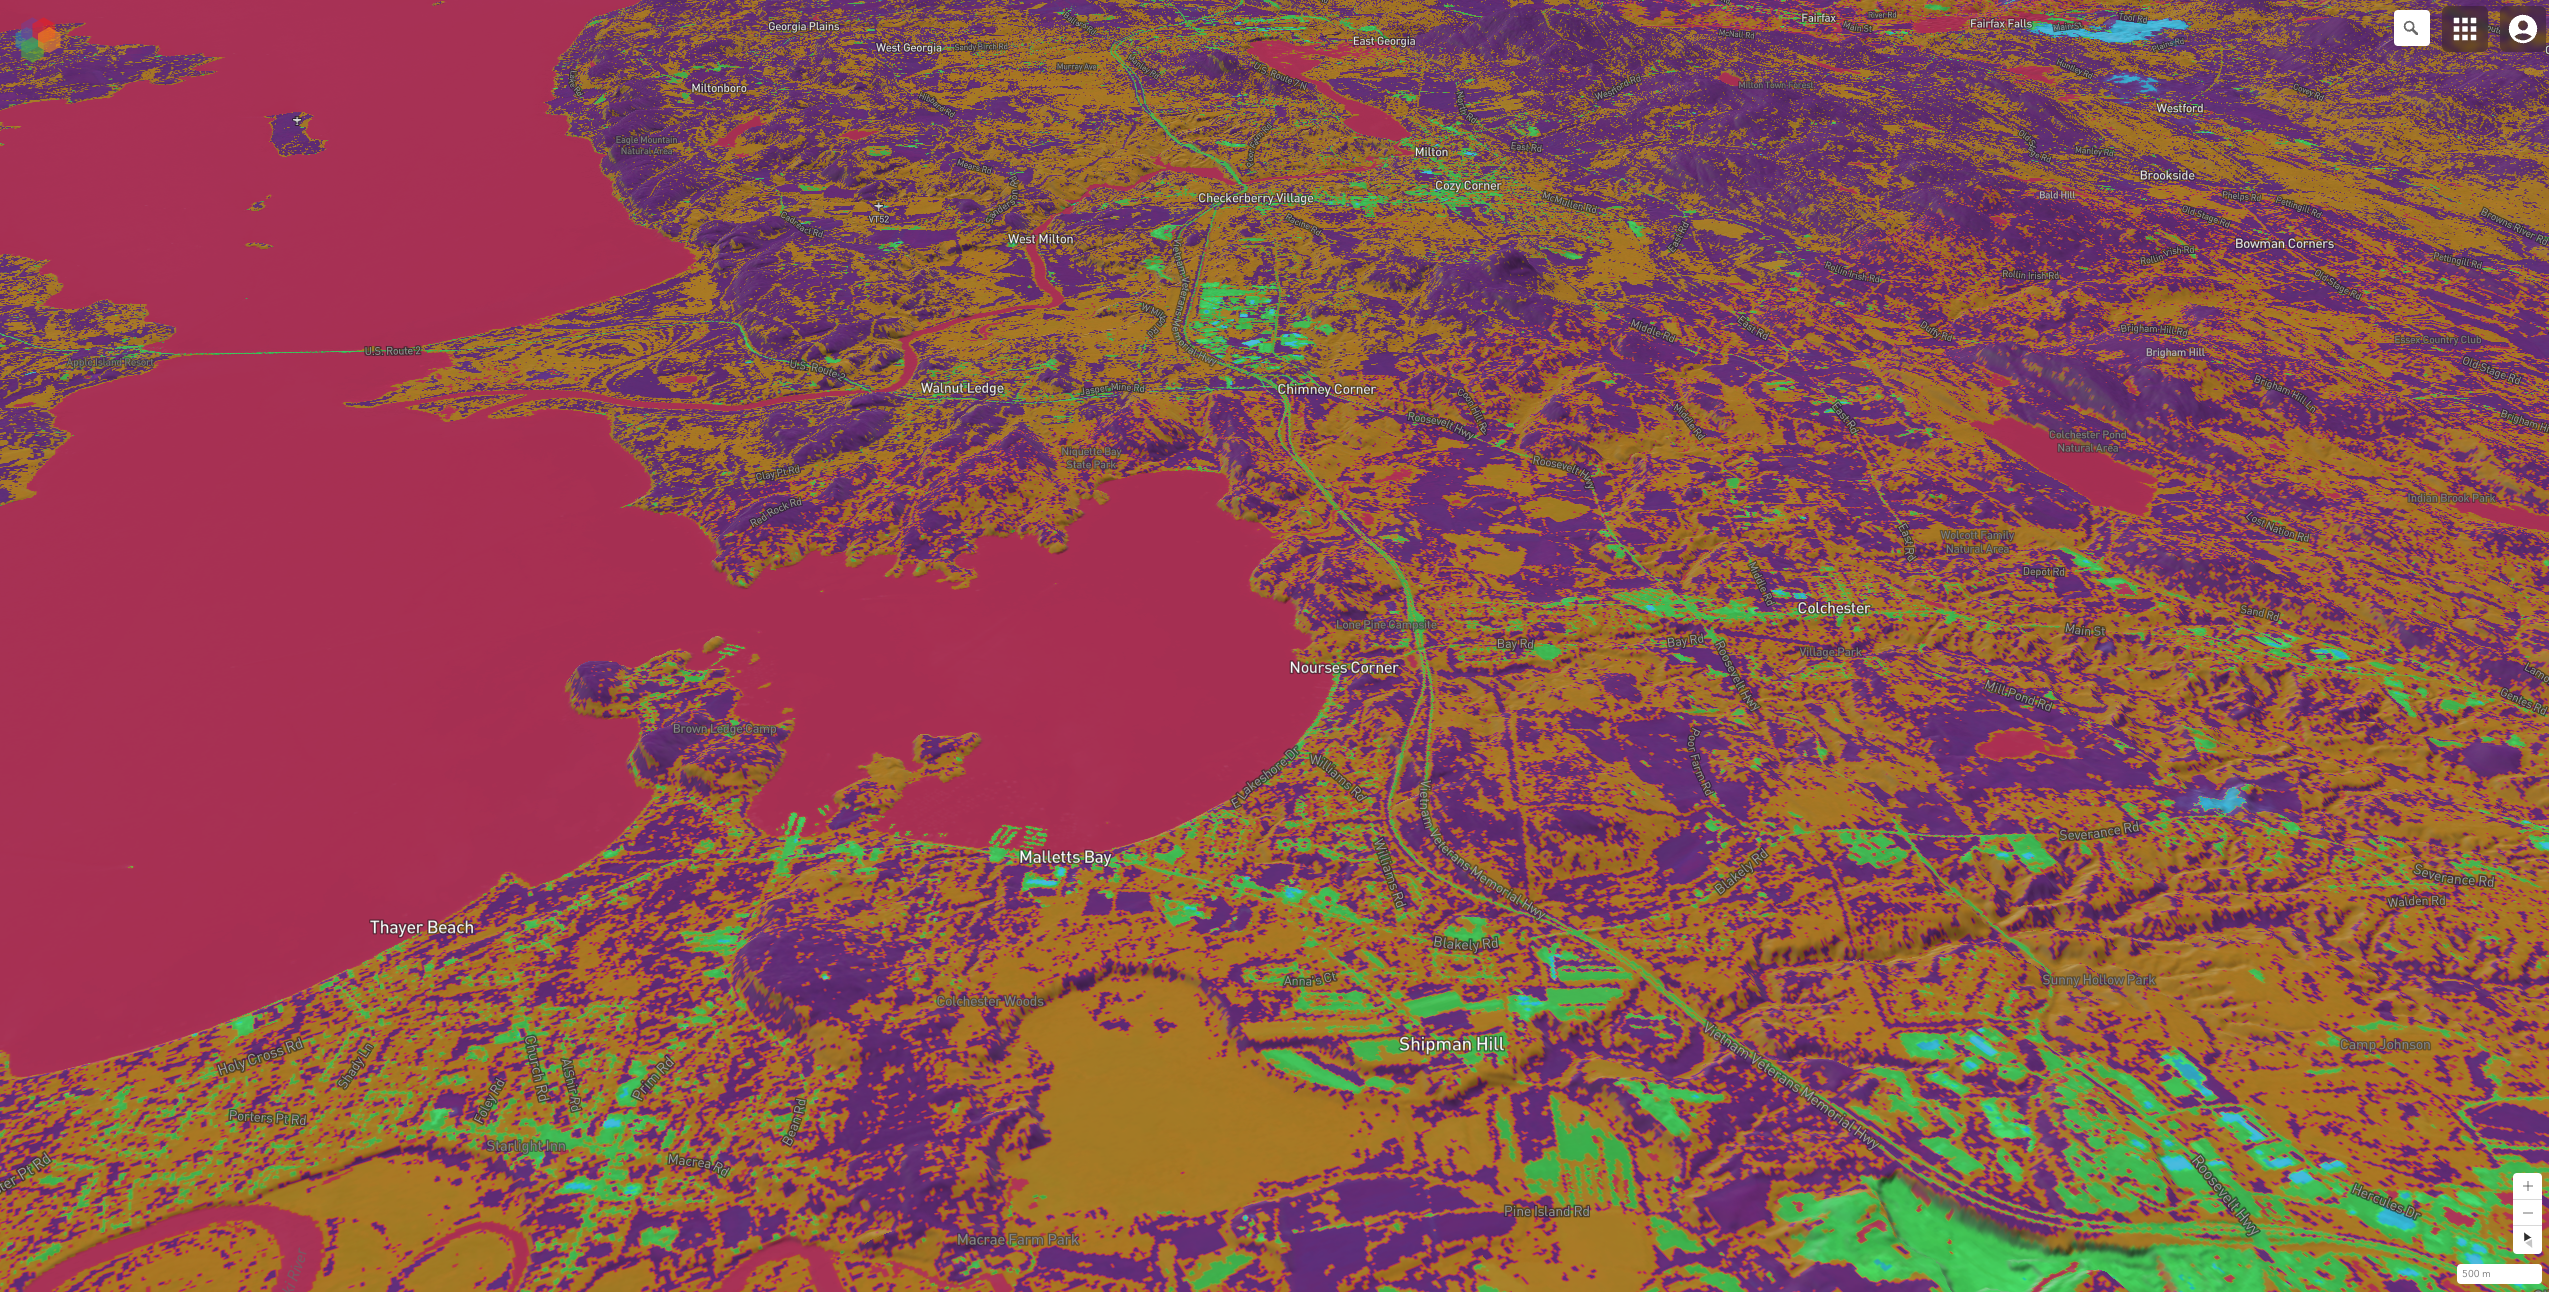
 Comparing a five-class k-means classification with Sentinel-2 L2A and National Land Cover Dataset (NLCD) in Explorer. Imagery over Chimney Point in Addison, Vermont.
The Batch Compute service is a Swiss Army knife that is used in nearly every stage of a modeling workflow. Customers use the service to efficiently ingest new data, generate training data, run model inference, and push model results out to other systems. Effectively any Python code can be easily parallelized on Descartes Labs’ cloud with just two API calls.
The Descartes Labs Catalog makes petabytes of geospatial data accessible to users at millisecond latencies. However, this data is not useful unless it can be processed effectively. The Batch Compute service solves this problem by providing flexibility and scale without forcing users to invest time and resources into building their own cloud computing pipelines.
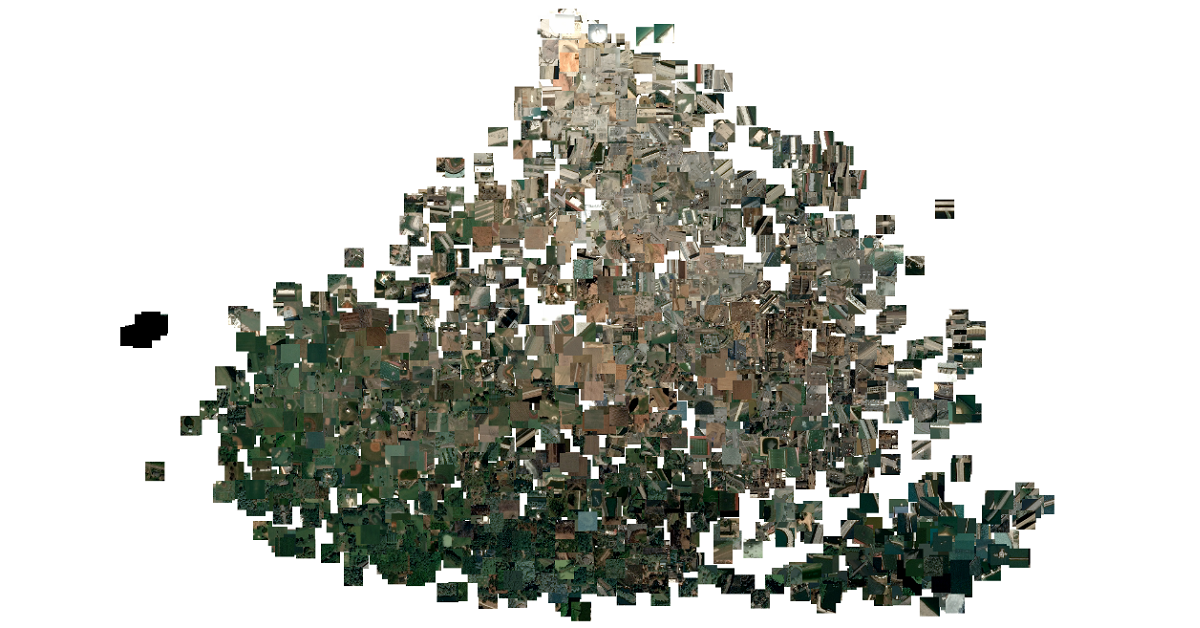
As an example, let’s say we want to classify land cover over all of CONUS. We have a trained k-means classifier that takes in three bands from Sentinel-2 L2A (near-infrared, red, and green) and classifies the imagery into one of five classes.
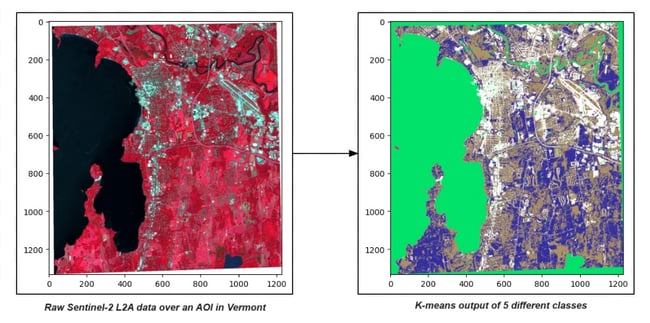
The sample above shows a 1,334 x 1,230-pixel classification generated from a 3 x 1,334 x 1,230-pixel input. Small areas like this can easily be run in a development environment like our Workbench server. However, we want to deploy our classifier over all of CONUS. Let’s take a look at how much data that is.
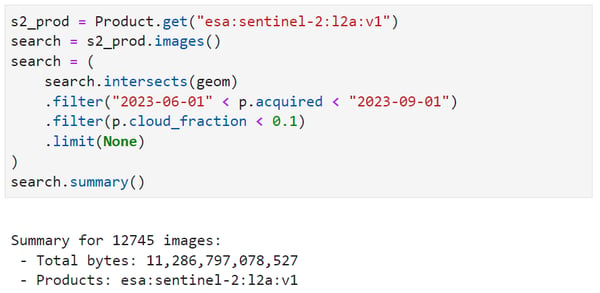
Over CONUS there are nearly 13,000 Sentinel-2 L2A images with less than 10% cloud cover from the summer months, totaling 11.3 TB. To process all of CONUS, we break the area into tiles of a reasonable size, which can be processed independently. Each area becomes a Job submitted to the Batch Compute service.
Dividing CONUS into UTM tiles of size 1024x1024, where each pixel is 10x10 meters, we arrive at 78,899 tiles.
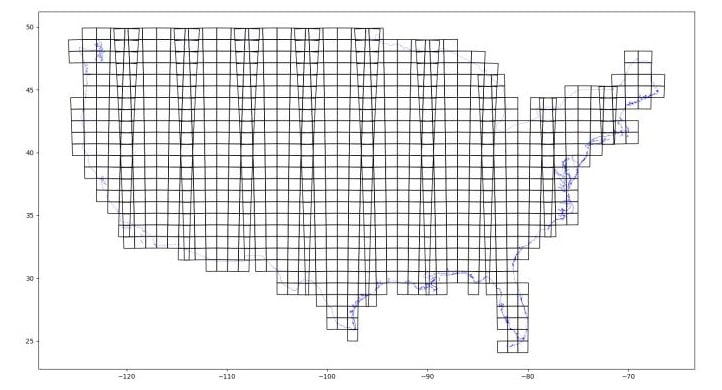 Each UTM tile in the grid above roughly represents 100 tiles of size 1024x1024 at 10-meter resolution.
We won’t go over the full processing steps here, but essentially our process will do the following:
We do this through a function called “write_kmeans_to_catalog” which accepts a tile ID and a Catalog Product ID as arguments. To turn that function into a distributed pipeline we need a couple of API calls:
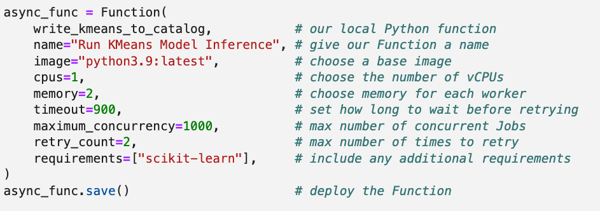
Once saved, the Batch Compute service will pull in any additional requirements (here, scikit-learn) and build a runnable Function that we can call over and over. Now all that’s left is to submit our tiles to the new Function: ![]()
Descartes Labs handles the environment creation, orchestration, scheduling, parallelization, retries and backoffs, logs storage, results storage, and more. Once jobs have been submitted, we can use a web application to monitor progress, diagnose any issues, and adjust settings.
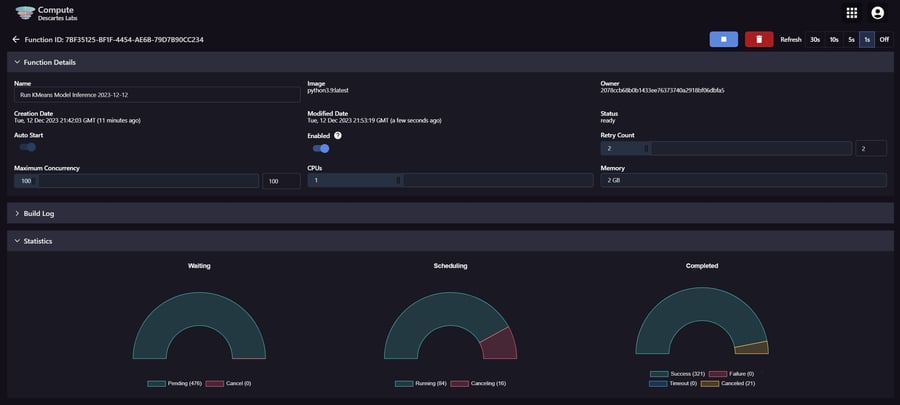 The Compute UI allows users to adjust key aspects of their Function, like concurrency, CPUs, memory, and retry count.
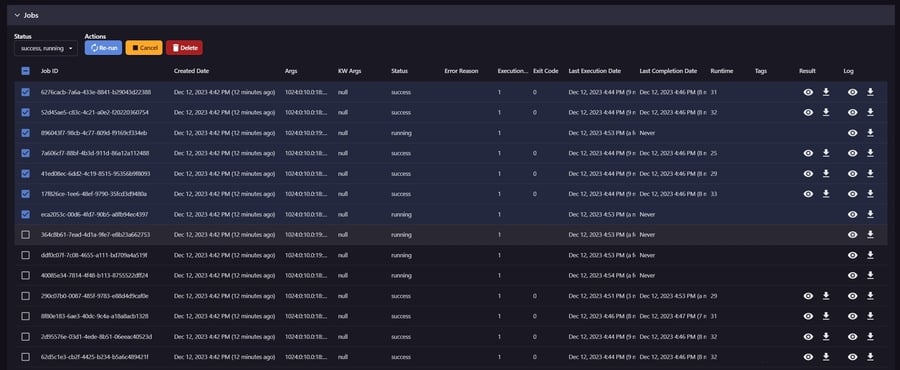 Jobs can be easily filtered and re-run or canceled, and their logs and results are viewable in-browser.
Once our processing is complete, results are viewable in Explorer. (see GIF at the top of this page).
Ultimately, the Batch Compute service streamlines data engineering workflows and drastically reduces the time spent wrangling massive quantities of data. With just two lines of code, users are empowered to run large-scale, complex geospatial analyses that bring research into production.
![]() If you are interested in learning more, contact our team to book a demo.
If you are interested in learning more, contact our team to book a demo.