Article category: Consumer Goods
Advancing the science of soy forecasting
Descartes Labs’ weekly forecast for U.S. corn and soy yields. Last month, we were excited to unveil...
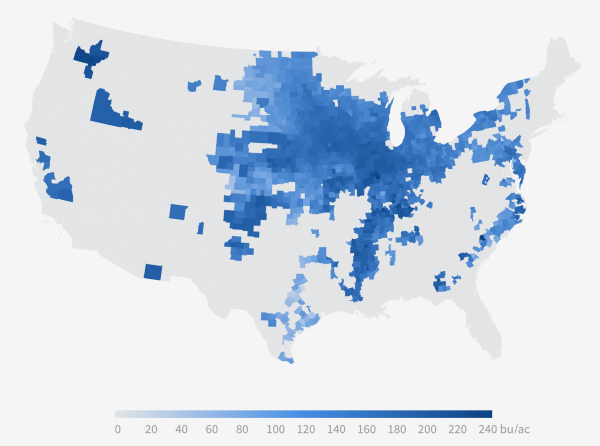
Today, Descartes Labs is releasing our 2016 U.S. Corn Yield Forecast. Not only is this year’s corn model vastly improved over last year’s model, but we’re also releasing our numbers to everyone. Every Tuesday, we will update our national forecast for corn, as well as for major corn-producing states and counties. You can find these numbers on our website, mobile app, and in our newsletter.
Unless you’re in agriculture, you probably only think about corn when you’re eating it off the cob. Corn is the largest and arguably most important crop in the US, but the vast majority of it doesn’t end up on your plate.
Let me briefly explain why understanding corn production is important and how the Descartes Labs Forecasting Platform allows us to tackle this incredibly difficult problem.
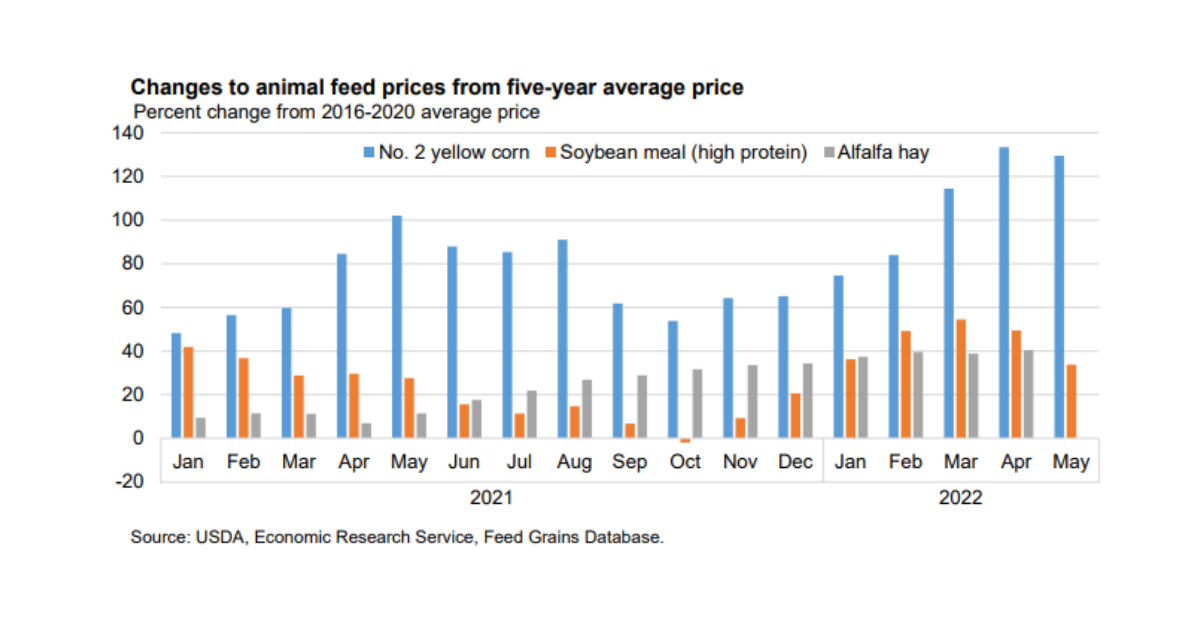
The United States is the number one producer of corn in the world, harvesting 13.6 billion bushels of corn last year using 80.7 million acres of land. That corn is used for many things, but largely for animal feed, ethanol, and corn syrup. Those involved in the growing, transportation, and processing of corn care about the size of the harvest crop. The amount of supply in the market affects price. Farmers want to know what their crop is worth.Those moving the grain want to be able to plan when and what kinds of trains and barges they’ll need. Insurers want to know their risk.
The US Department of Agriculture (USDA) does an incredible job of forecasting the US corn crop — better than any other country in the world. They release monthly forecasts for corn production at the state and country level, starting in August. The final report comes out in January and this is the first time county-level yields are reported. To create these reports, the USDA surveys farmers, tours farms to sample data from fields, and rolls this data up into a projection of how many acres will be harvested, the yield, and the total number of bushels of corn that will be produced.
Descartes Labs’ forecast has several advantages over the USDA survey-based system. Our yield forecasts are produced weekly. This increased cadence means more efficiency in the corn supply chain. We also forecast in-season county-level yields, giving better local visibility to farmers and grain buyers. For example, grain elevators price corn locally, based on the local supply of corn from farmers. By understanding that supply, elevator managers can price corn for better market efficiency. Finally, because our forecast relies on satellites and weather stations that image the Earth every day, we can survey every field in every farm every day, translating into better accuracy.
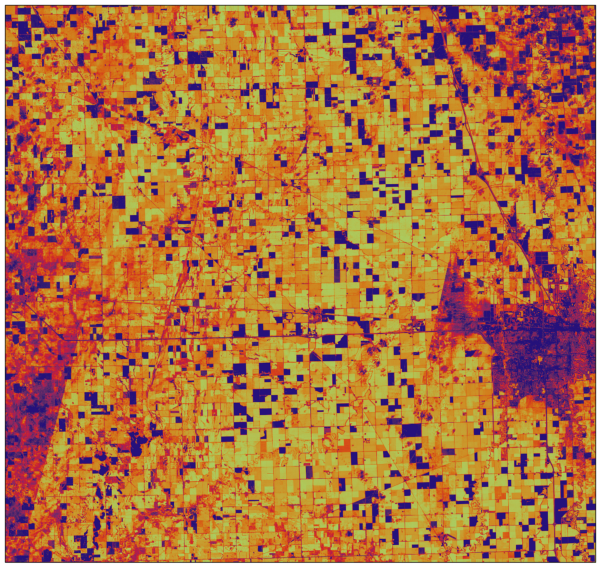
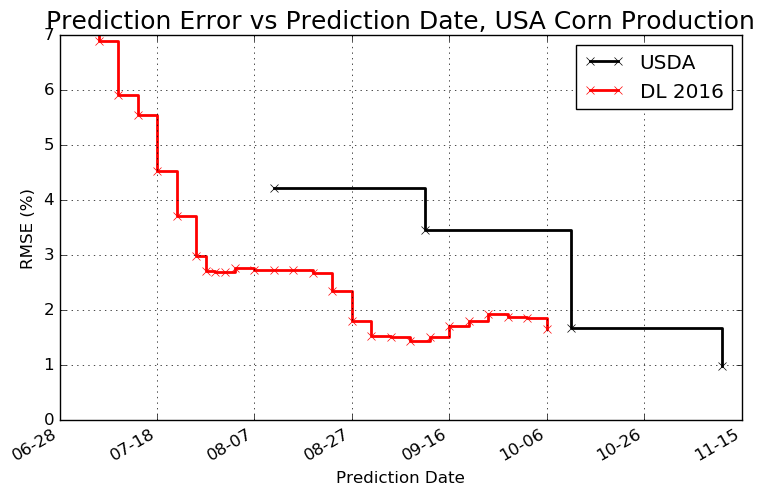
Descartes Labs has built a forecasting platform that allows us to ingest, process, and analyze massive data sets. Last year, we started exploring what could be done with satellite and weather data for agriculture. During the growing season, we analyzed spectral signatures for corn, which gave us information about crop health and relative productivity. We combined this information with detailed weather data and knowledge of how weather variables differentially affect corn during the growing season to build our forecast models. After processing a petabyte of data in just 16 hours using 30,000 computer cores, we used that dataset to build an extremely accurate U.S. corn production forecast—so accurate that, in an 11 year backtest, our predictions had lower error than the USDA’s forecasts at every point in the growing season.
In 2016, we made many improvements in our model.
This year’s model is more frequent. we produce forecasts at the county, state, and national level every two days instead of every four. Though we’re only releasing weekly to the public, our customers have access to more frequent forecast updates.
We’ve made many improvements to accuracy, especially in the early season. For example, our statistical error on August 4—a week before the USDA’s August report—is reduced from 3.09% in the last year’s model, down to 2.37% in this year’s model. That early season accuracy gives better visibility to anyone growing or buying corn. Many of these improvements rely heavily on our ability to create weather models that feed into our corn model. Though satellite imagery of a plant will tell you how healthy the crop looks now, weather data gives you a sense of how that health will change over the next few days.
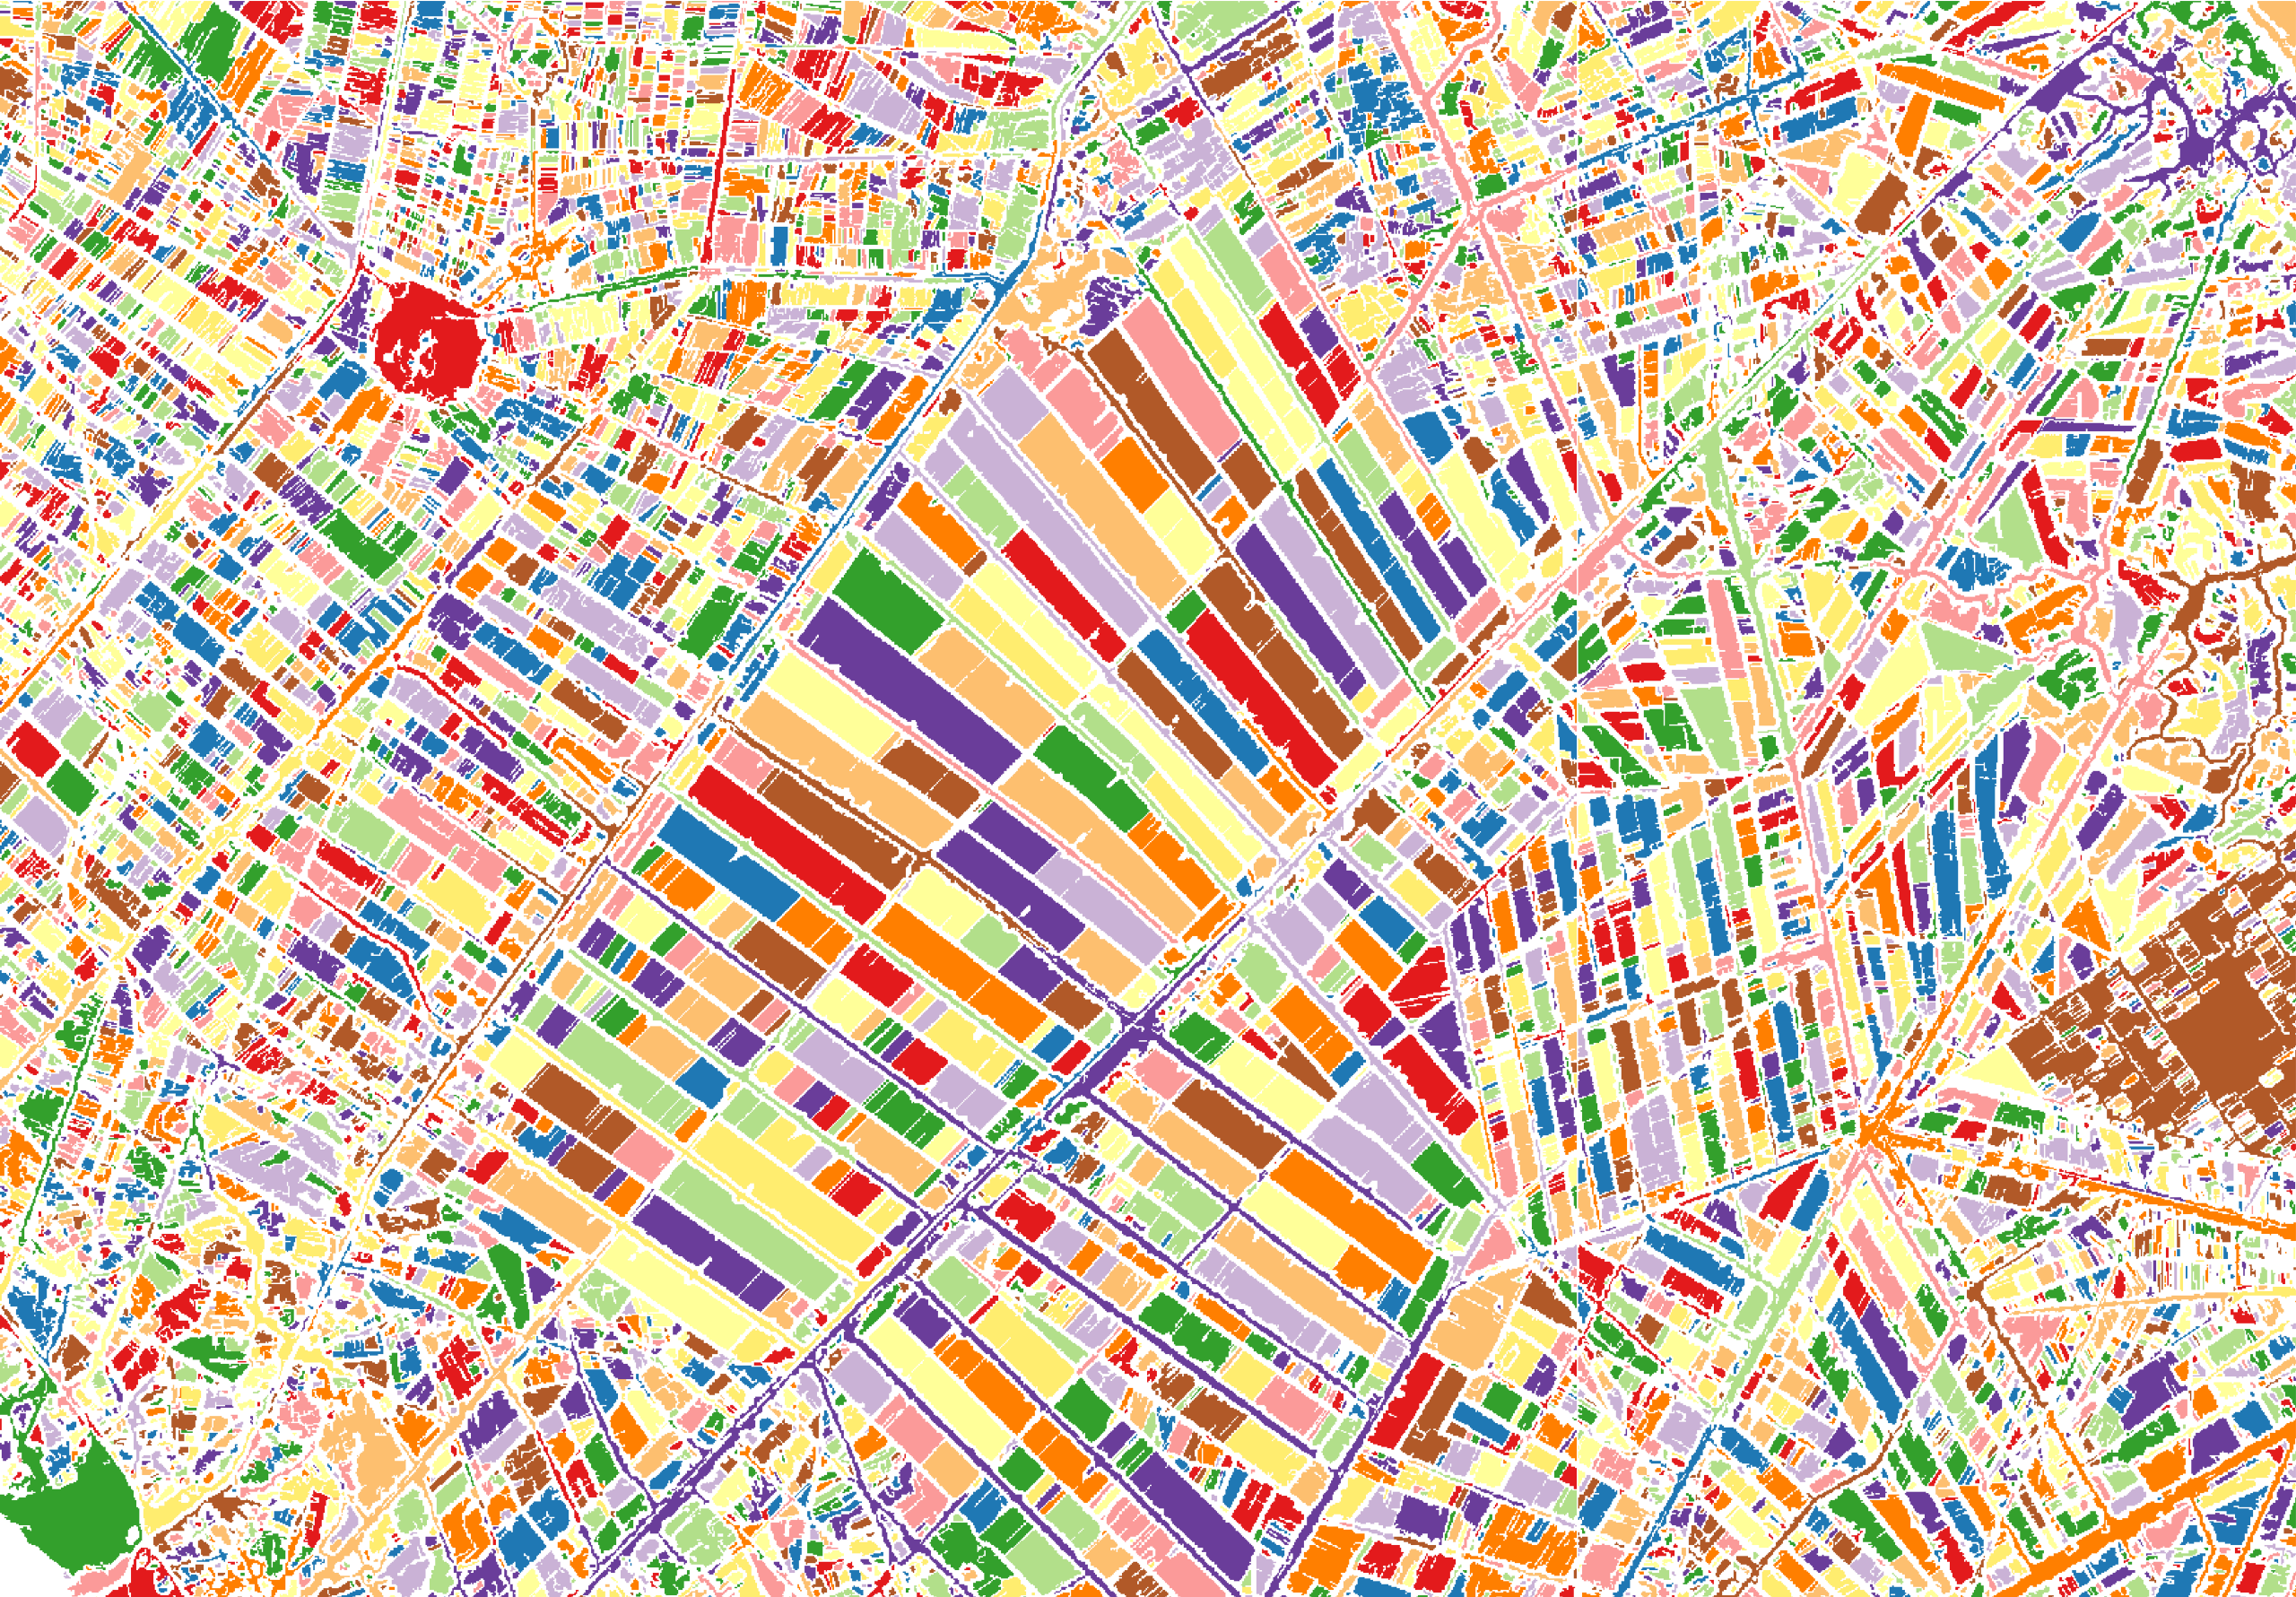
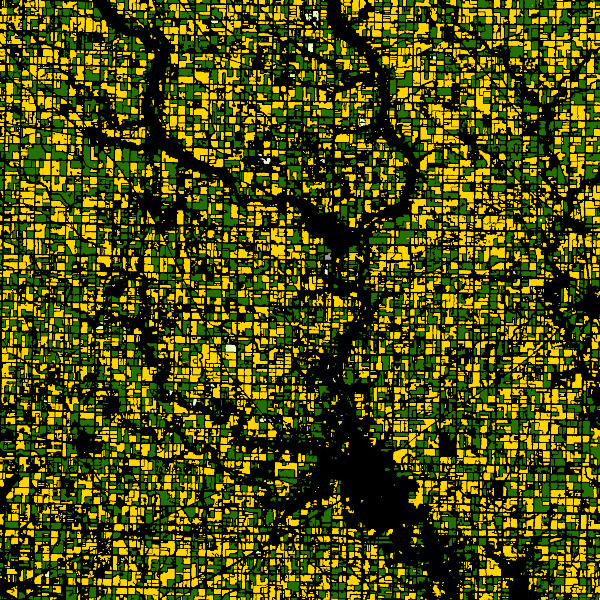
More data means more accuracy. We tripled the size of our data corpus: we now have over 3 petabytes of compressed satellite data in our archive (1 petabyte = 8,000,000,000,000,000 bits of information), with 5 terabytes of new data being ingested and analyzed every day. This extra data allows us to build better algorithms. For example, we’ve dramatically improved our ability to differentiate between corn and other crops thanks to higher resolution imagery. This allows us to make an in-season map of fields and what crop is growing in them. The CropScape Cropland Data Layer (CDL), produced by the USDA, also does this, but not until the after the growing season is over. We also produce crop progress and condition data derived from satellite imagery.
We have better data. Because last year’s model was so accurate, we’ve had to correct for extremely subtle issues with the atmosphere to improve further. We’re now far better at detecting clouds, both those that are obvious to the naked eye and those that aren’t. But we also made many other adjustments to correct for the way light passes through the atmosphere. Our model is based on physics, and our understanding of this science is critical to achieving errors of the order of 1% or less.
Descartes Labs is using huge datasets and machine learning to help us better forecast the future, allowing leaders at the local and global level to make more informed decisions. Releasing this corn number weekly is just the first step. We’ll expand beyond corn to soy and other major commodity crops and add more geographies, where government forecasts are not nearly as good as the U.S.
Stay tuned and in the meantime, and we invite you to visit our website, download our app, and subscribe to our newsletter.