Article category: Science & Technology
Using Petabytes of Pixels with Python to Create 3 New...
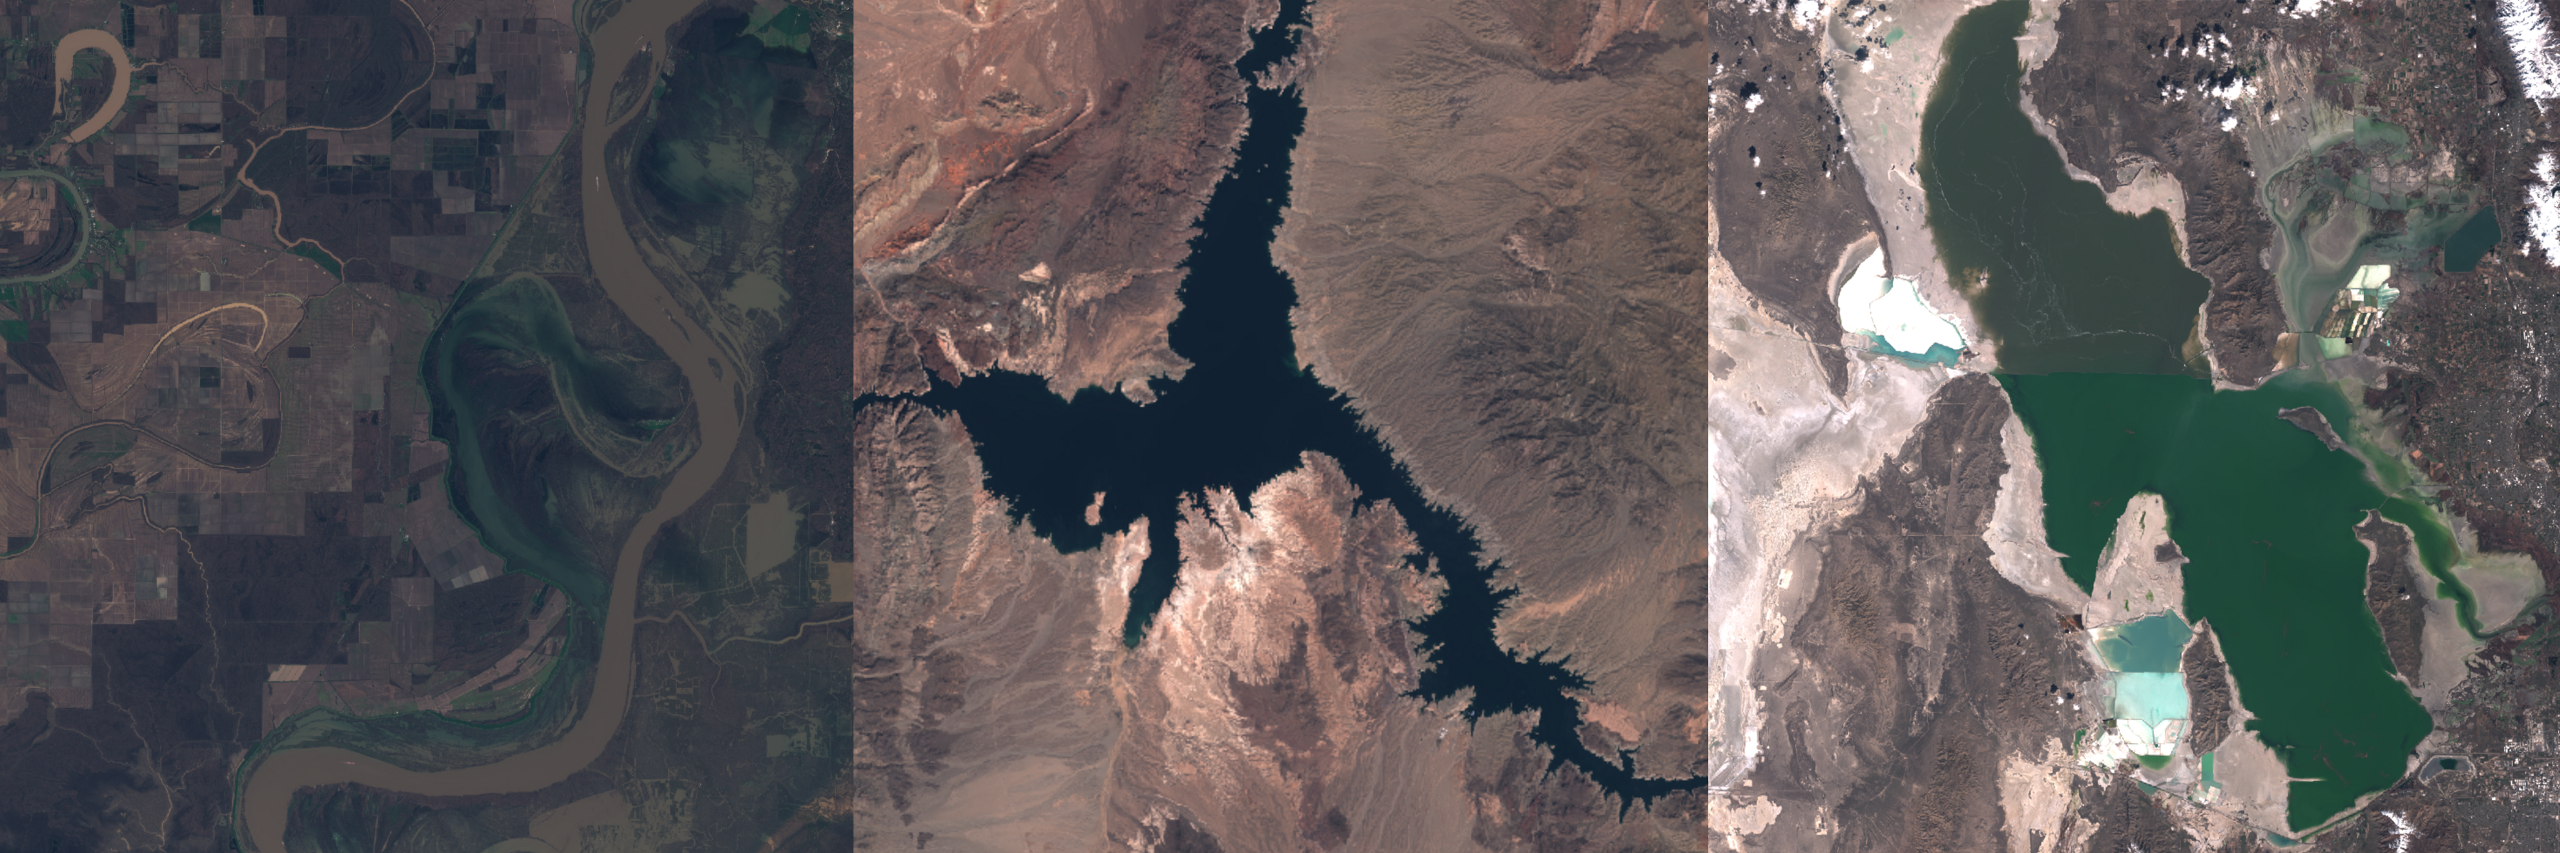
View three new satellite imagery-based maps of the earth, made at Descartes Labs. These are global...
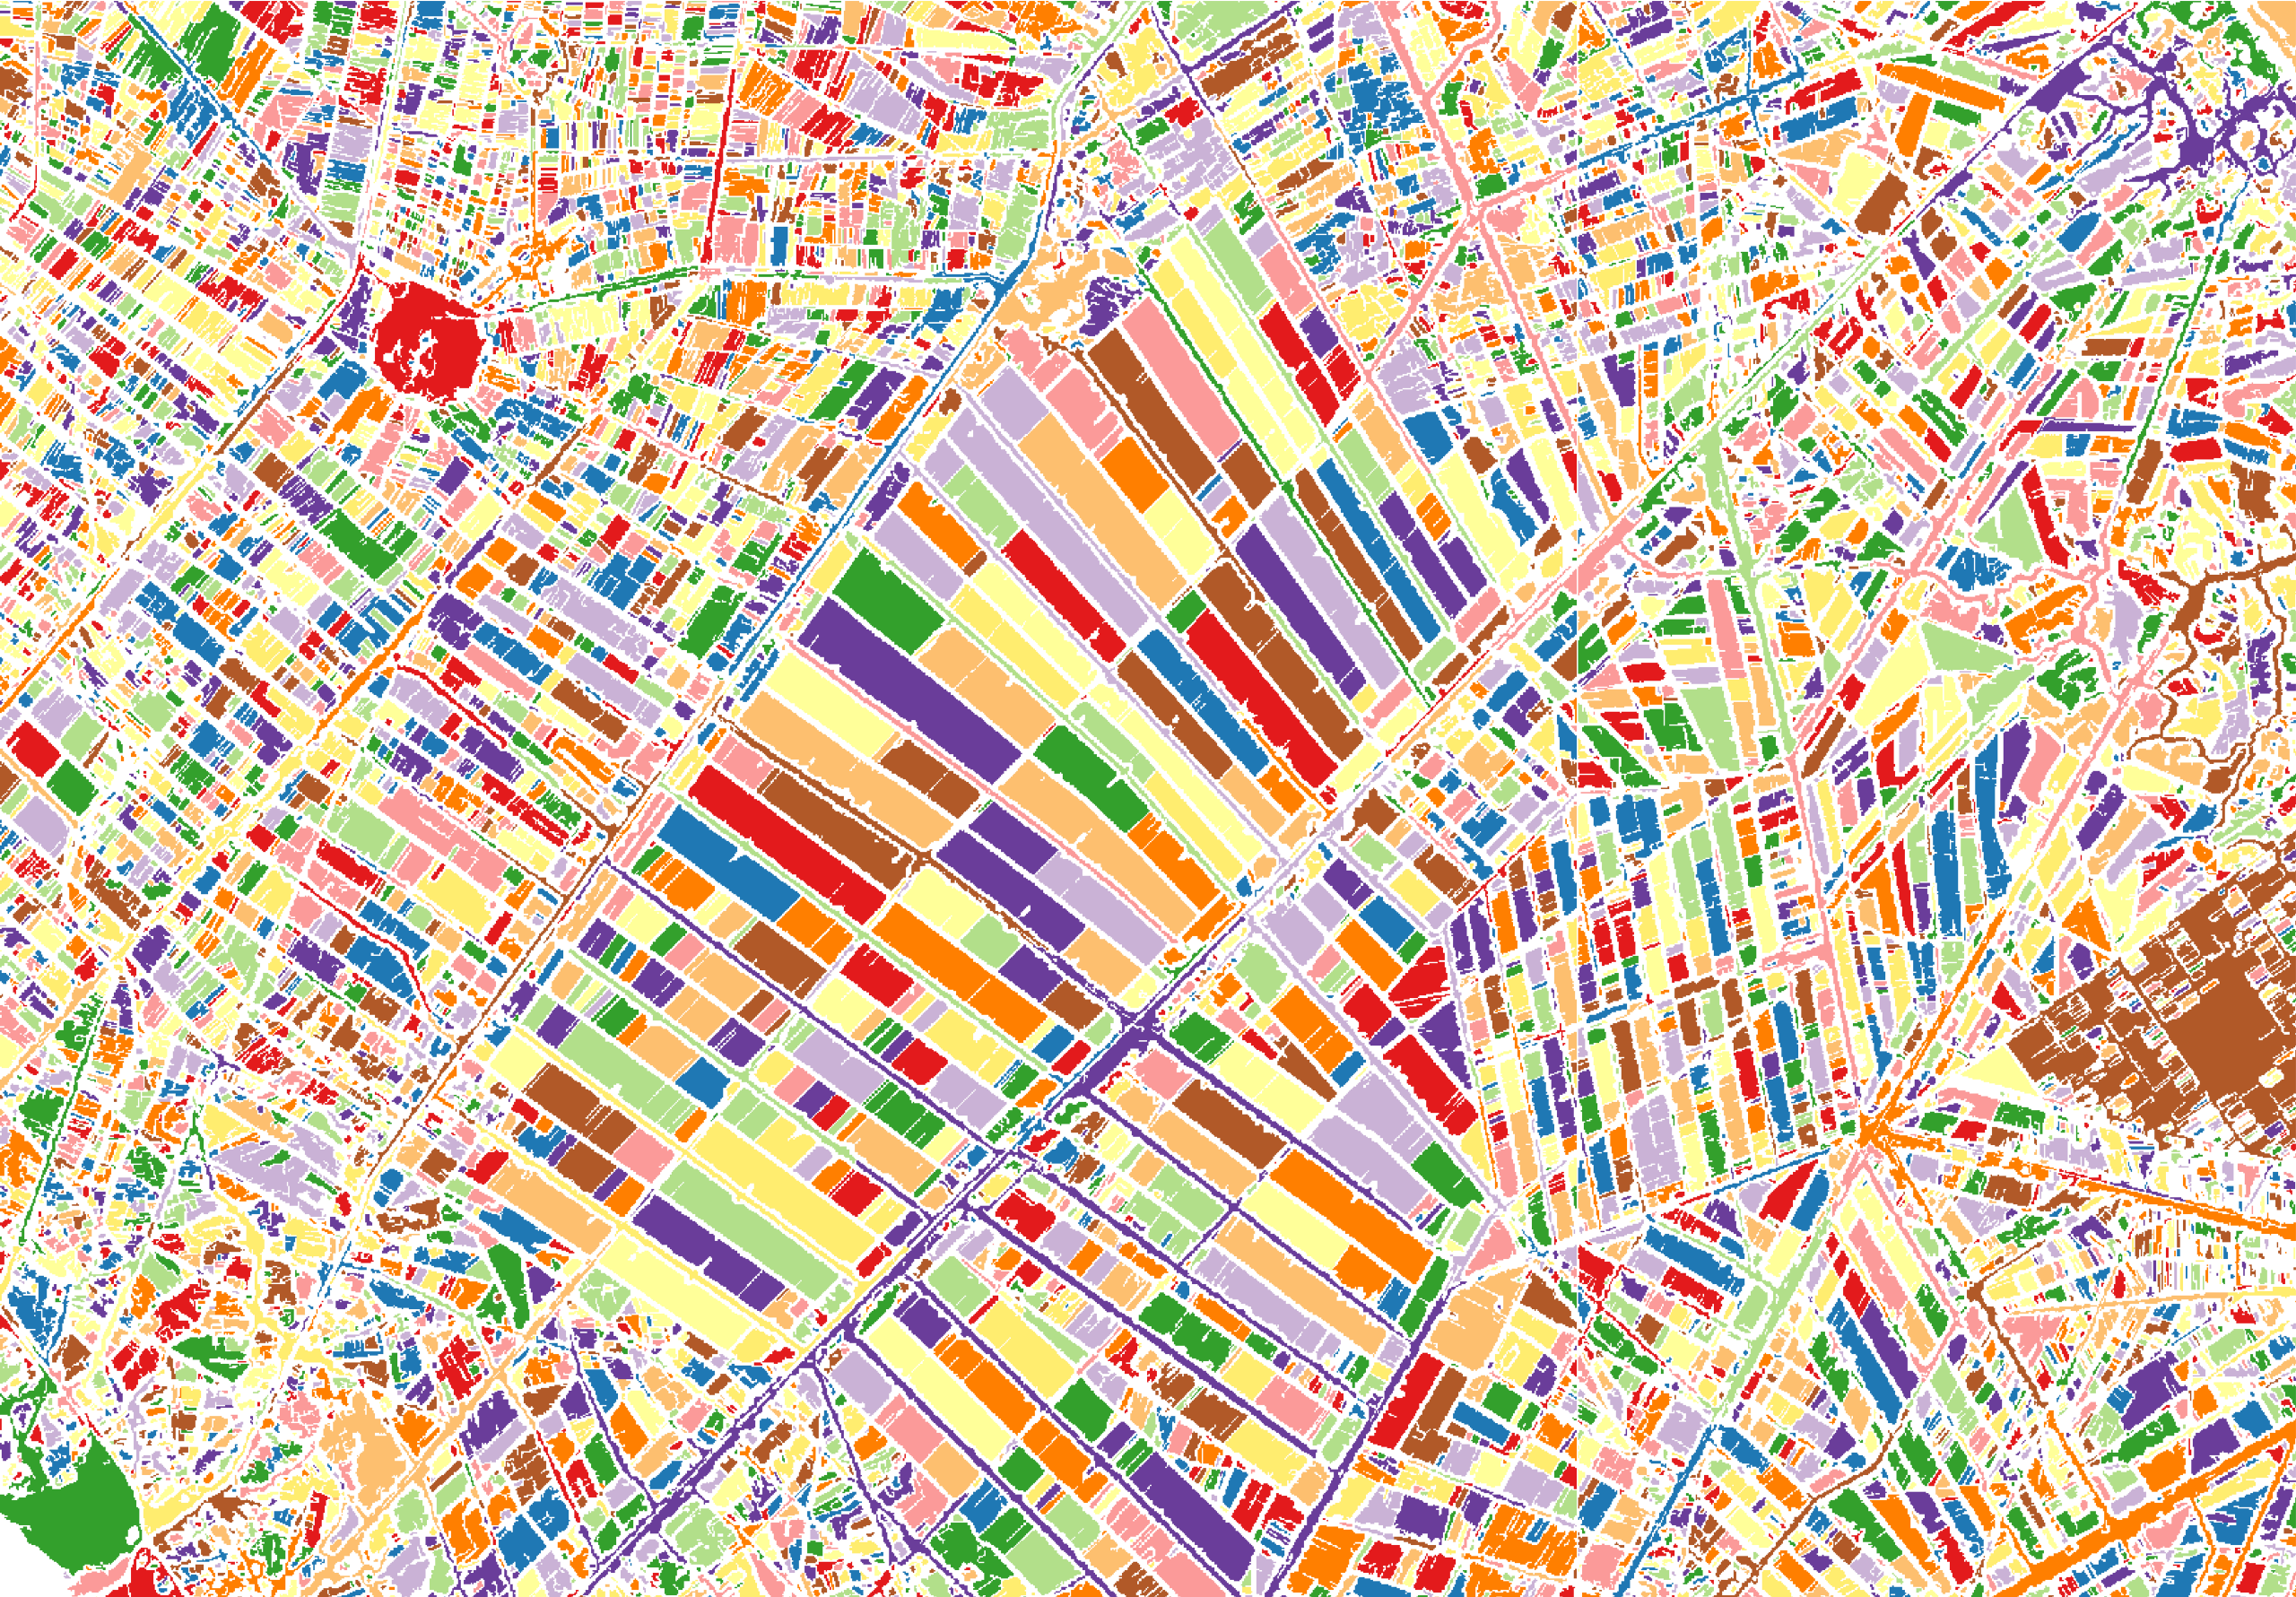
At Descartes Labs, we got our start modeling agricultural yields using data from satellites. Along the way, our scientists secured multiple patents around creating field boundary maps from satellite data. Understanding locations of fields and their boundaries are fundamental building blocks in accurately modeling acreages and yields for all kinds of crops.
Our algorithm looks at each pixel value and the difference between neighboring pixels across different data types and geographies. A large change in pixel value indicates an edge. Edges that we find persistently let us distinguish field boundaries from spurious edges, like those of clouds or their shadows.
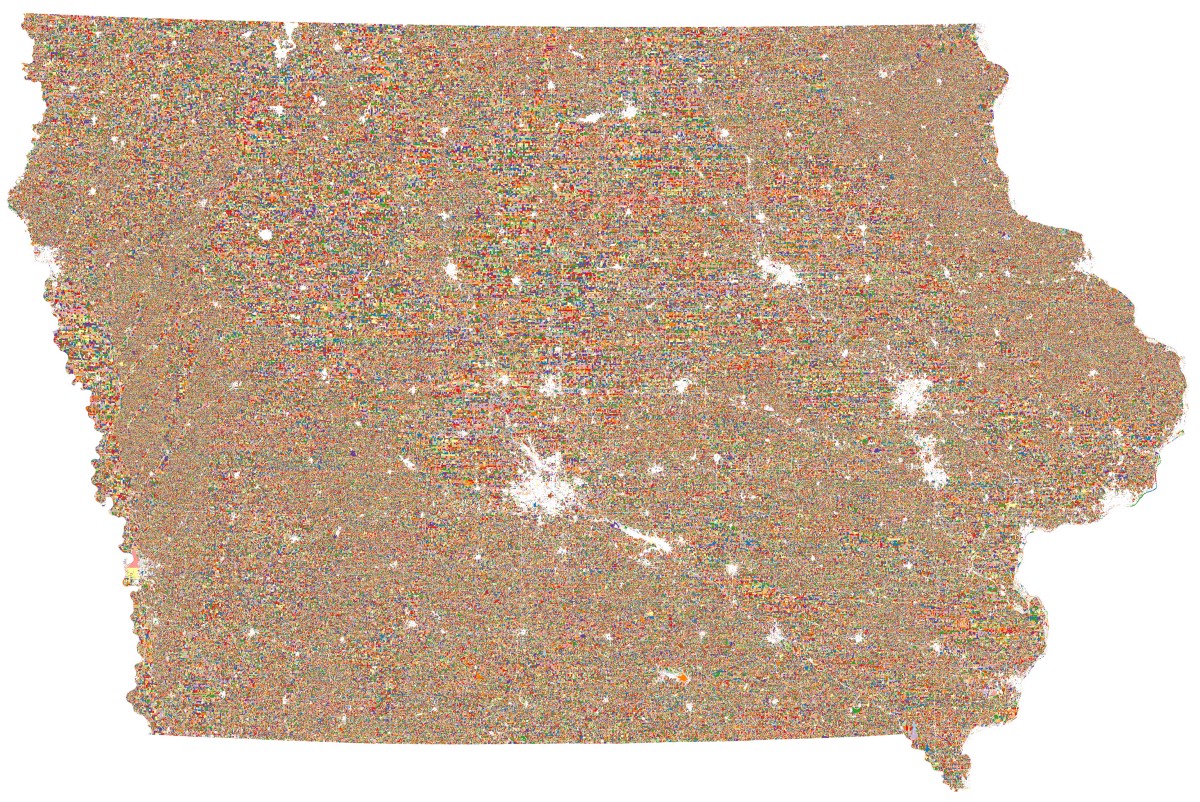
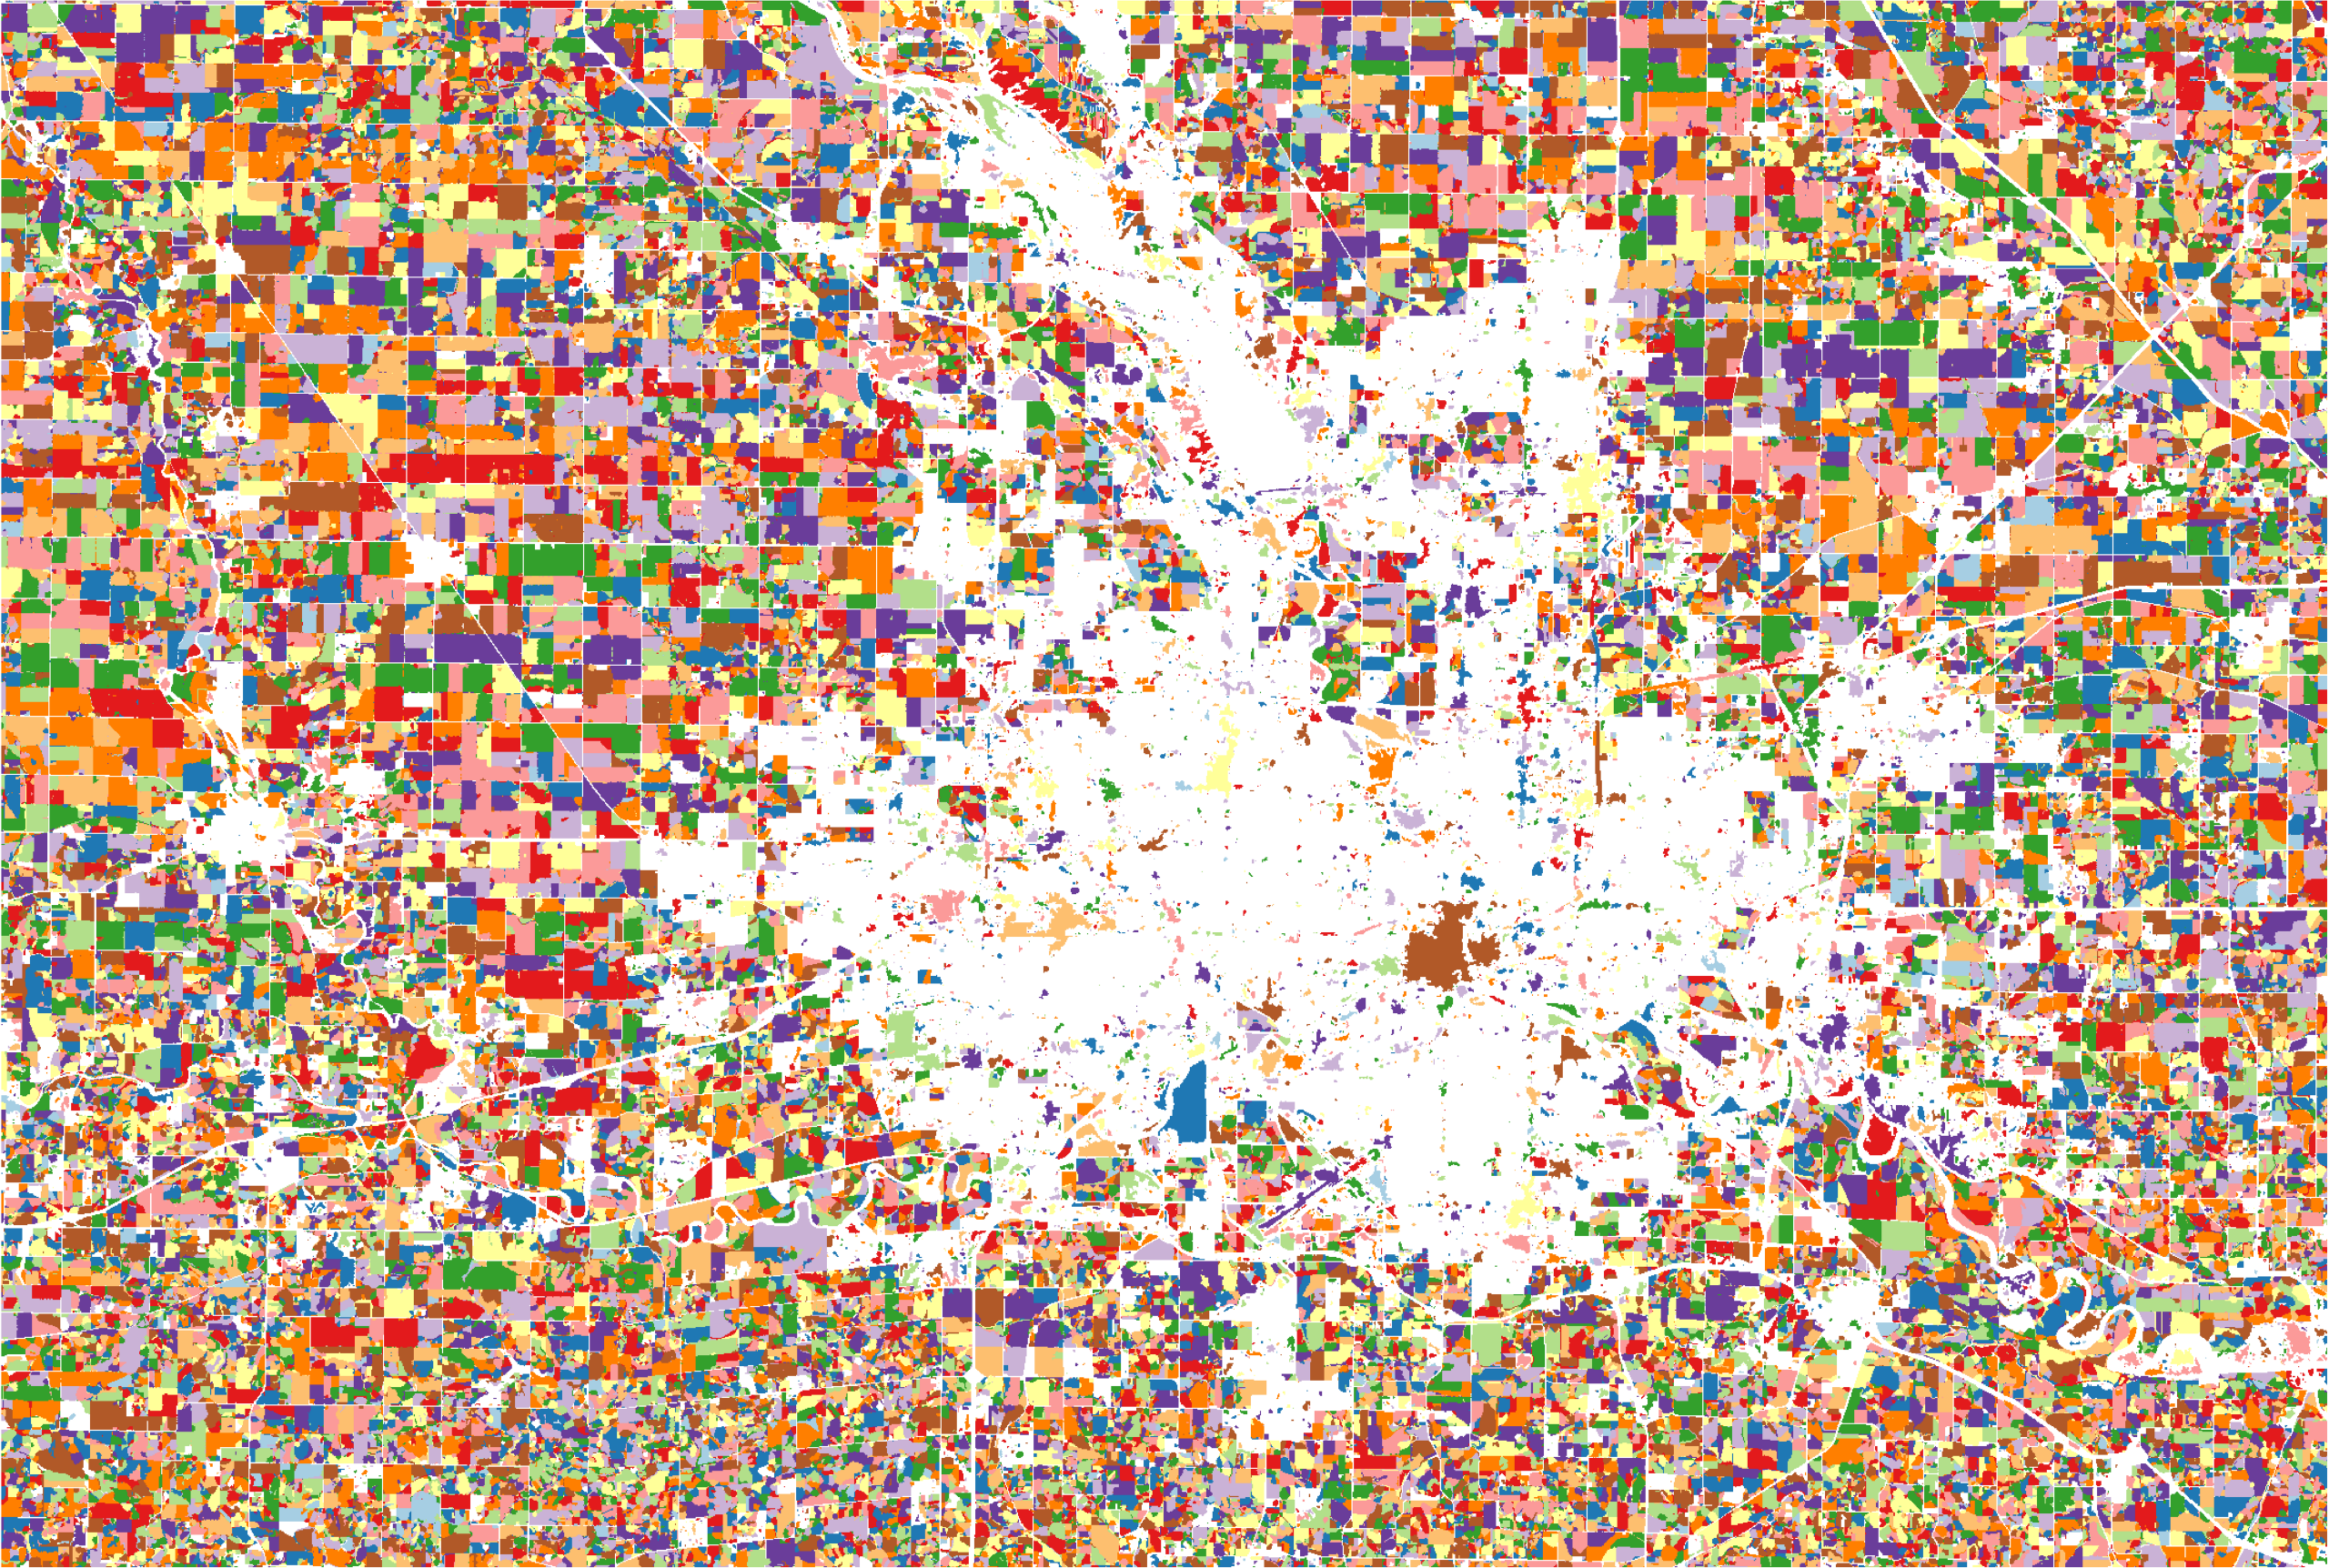
In the United States, we use optical imagery, like NASA’s Landsat, to identify fields. In densely farmed areas like Iowa, you can see that fields are rectilinear and closely packed.
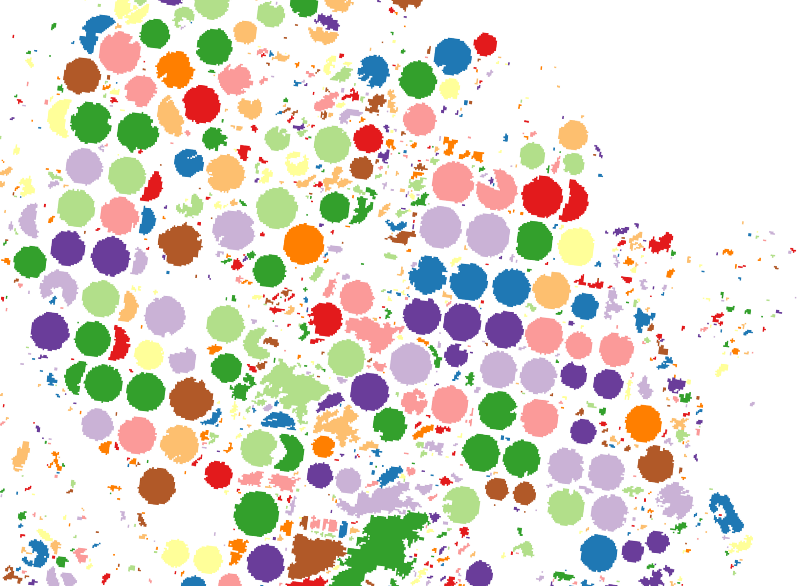
Out west, in places like New Mexico where Descartes Labs is headquartered, you can clearly see circular center pivot irrigation fields.
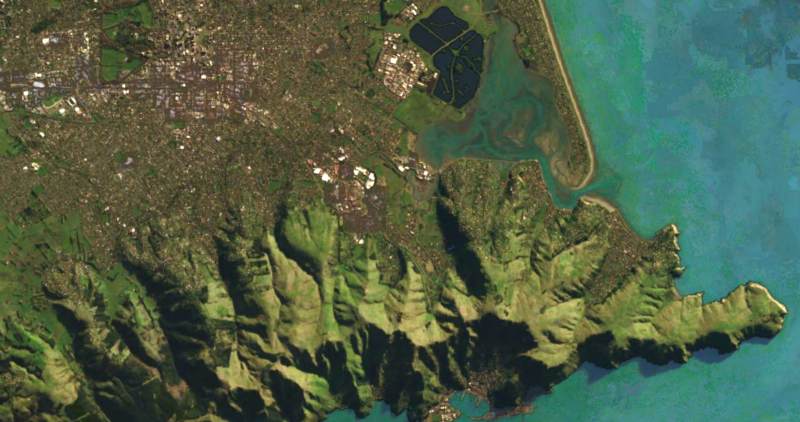
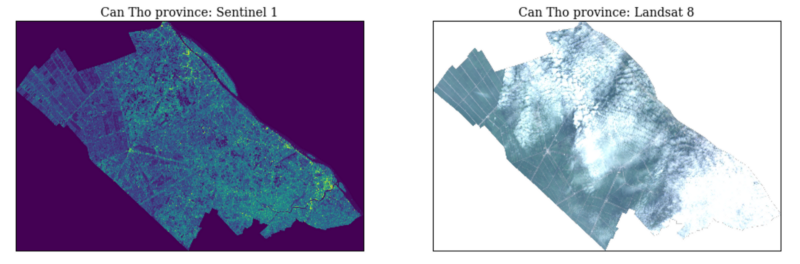
Unfortunately, optical imagery doesn’t work through clouds—a major issue in tropical regions, like Vietnam, where crops like rice are grown. Luckily there’s a type of sensor—synthetic aperture radar (SAR) from the European Space Agency’s Sentinel-1 satellite—that can see through clouds. Optical imagery people are most familiar with is collected passively; a sensor aboard a satellite orbits the Earth and records the visible and infrared light reflected from its surface. SAR data, on the other hand, is collected actively when a sensor emits a pulse of radar to the surface of the Earth and records the backscatter that is returned. Though invisible to the human eye, the microwave radiation that is emitted has a long enough wavelength to penetrate clouds, which means those obstacles are removed. For imagery collected on the same date, if the landscape is obscured by clouds in Landsat 8 imagery, Sentinel-1 data will be completely cloud-free:
Understanding global food security requires a year round view into cloudy, tropical areas. Corn and soy crops generally do not feed people directly. Instead, they become cattle feed, biodiesel, or other derivatives. The rice grown in tropical regions is different—people eat rice. In fact, over 20% of the global calorie supply is composed of rice, and it is a staple crop for nearly a billion people who live on less than $1.25 per day.
Vietnam is one of the world’s largest rice exporters and the majority of the country’s exported rice is grown in the Mekong River Delta. The monsoon season in this region lasts from May until November. During that time period, we’re lucky to get a single Landsat scene that is relatively cloud-free and suitable for analysis. With Sentinel-1 SAR data, clouds are irrelevant, so we can get a clear view of the landscape throughout the entire year.
Most of the world’s rice is grown in low-lying tropical deltas, like the Mekong, where the elevation of the entire region averages only two meters above sea level. These deltas are particularly susceptible to the effects of climate change. Rising oceans are a concern along with the perhaps more insidious slow creep of salinity intrusion. This occurs when salt water flows into freshwater rivers during the dry season and permeates surrounding landscapes, wreaking havoc on crops. Given that seas and temperatures will both rise in the coming decades, understanding the locations and health of rice crops will have critical implications for the populations that depend upon them.
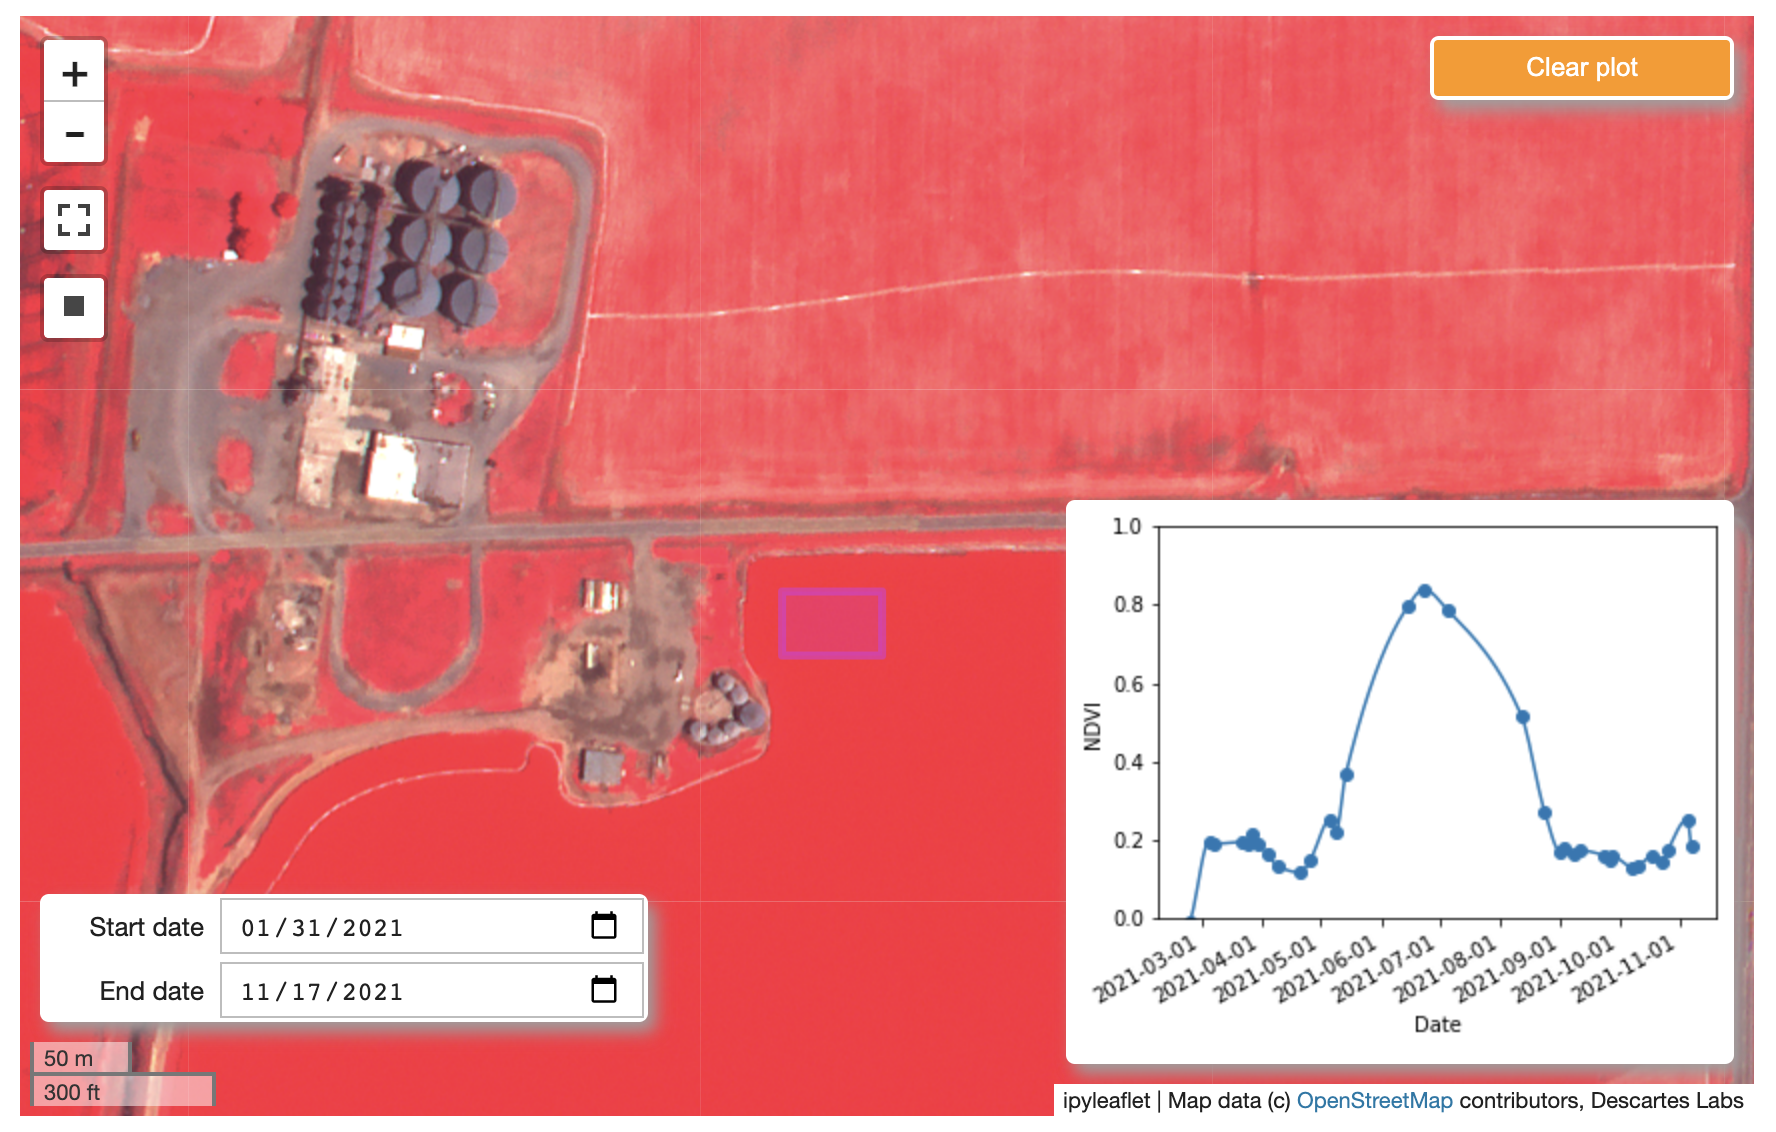
Our field mapping capability aims at creating a deeper understanding of the changing face of agriculture and food supply on the planet. Once we know where fields are, we can incorporate phenological and spectral information to classify crop types and use weather data to build yield models. Greater visibility in agriculture, based on global data and machine learning models, has implications for resource allocation, biodiversity, drought preparedness, and of course global food security. Though we’ve diversified our applications since the early days of the company, we continue to be passionate about agriculture and all of its critical impacts on humanity.