Article category: Science & Technology, Climate Solutions
Global-scale water monitoring in the cloud
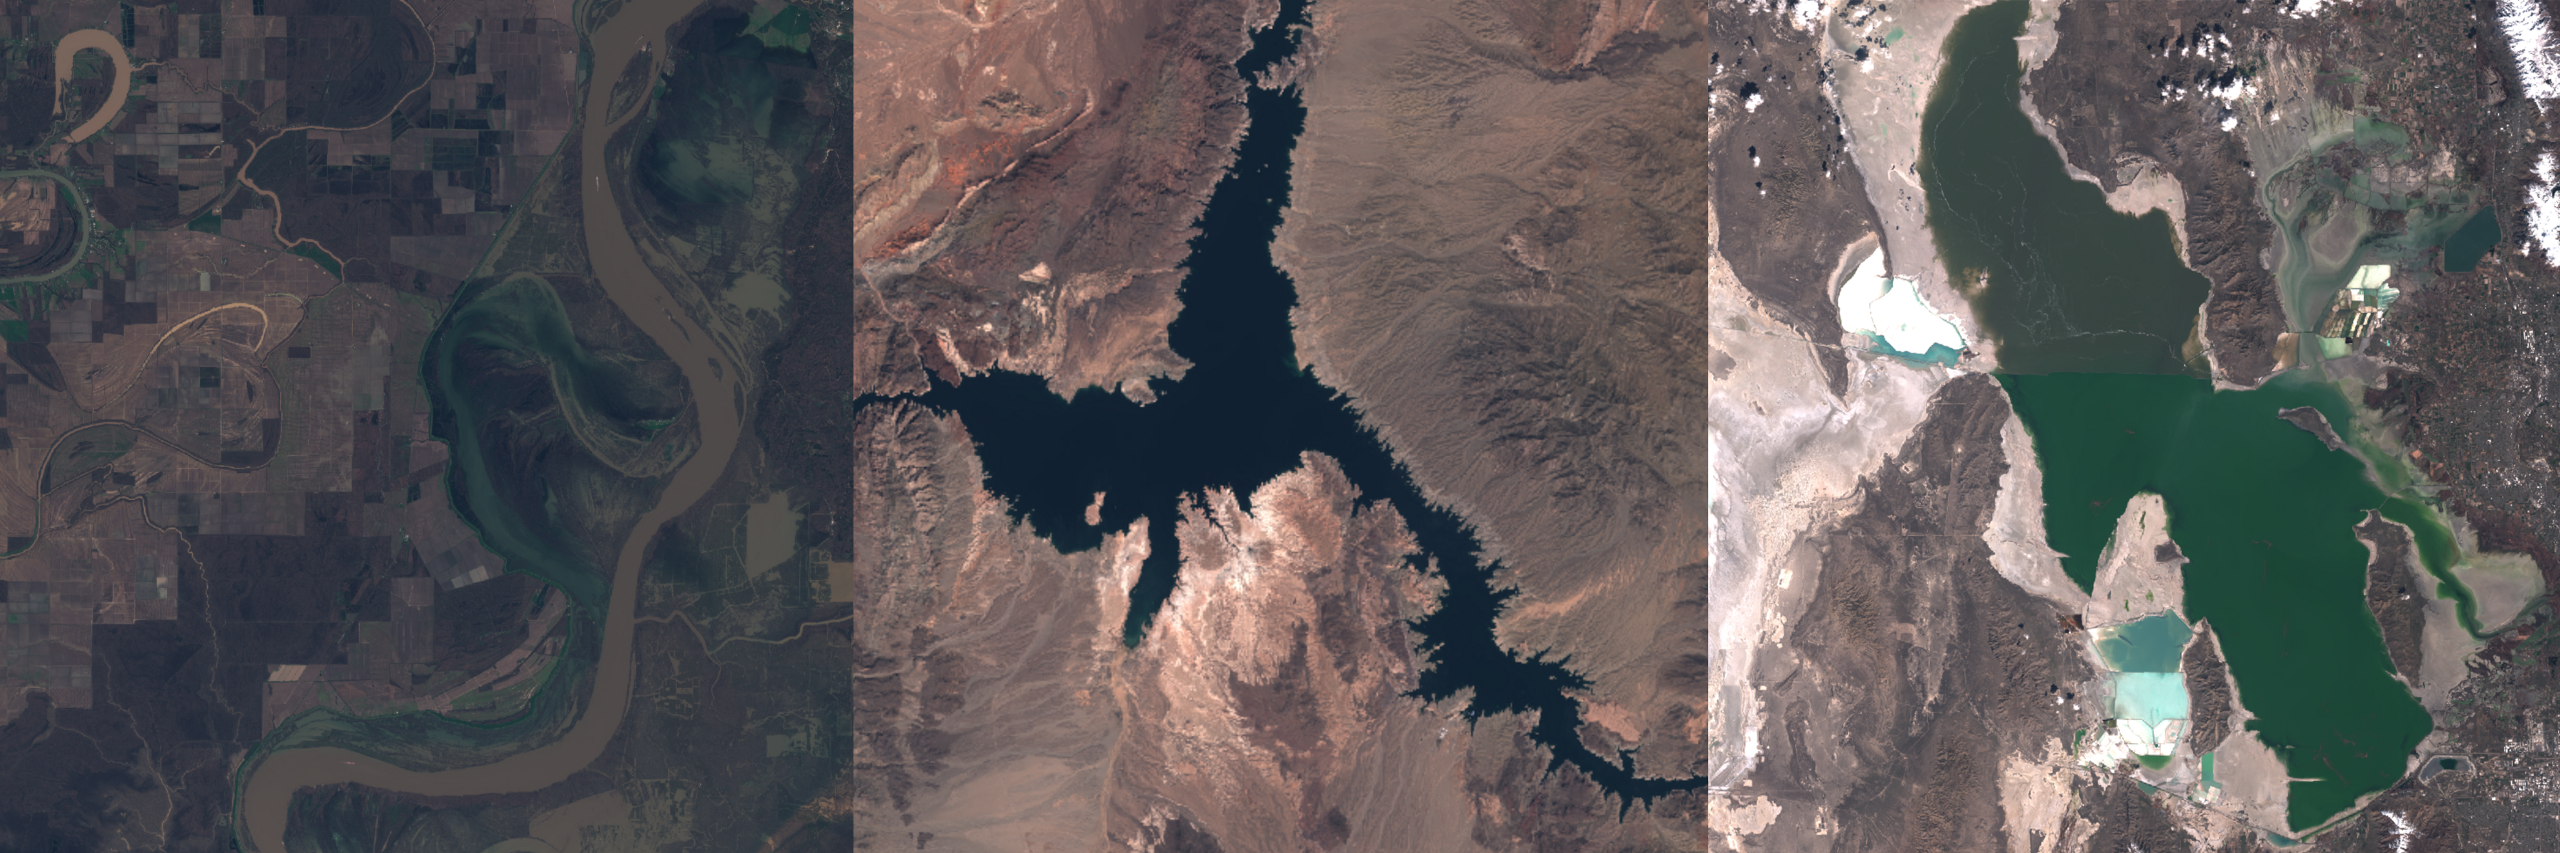
The many shapes and colors of water, from a silt-laden river in Louisiana to Lake Mead, Nevada to...
Today we’re excited to share three new satellite imagery-based maps of the earth, made here at Descartes Labs. These are global composite images constructed using data from the Landsat 8, Sentinel-2A, and Sentinel-1 satellites.
We hope you enjoy browsing through this beautiful imagery as much as we do, but we also wanted to give you some technical background on what we made and how we made it.
First of all, what is a composite image?
Think of the satellite image view in Google Maps. There’s something strange going on here. Where are the clouds? And why is the whole world green with summer vegetation?
This is made by possible by combining multiple views of the same location into one. A kind of synthetic, summary image. A composite image.
Despite the artifice, the result can be incredibly useful. The earth never looked quite like this, and yet a composite is an excellent representation of what the earth looks like.
But how to actually combine many images into one? You can imagine a few different algorithms that might work: using the most recent image, the least cloudy image, or the image with the healthiest vegetation. Or perhaps mathematical functions operating on individual pixels, like the minimum, mean, or median value across time.
In fact, these are all useful techniques, and we mix and match them depending on the application. A composite best suited for monitoring crop yields is different from the one best suited for classifying land cover, or for detecting objects with computer vision algorithms.
We’ve applied the methods described above to create three new global composite images.
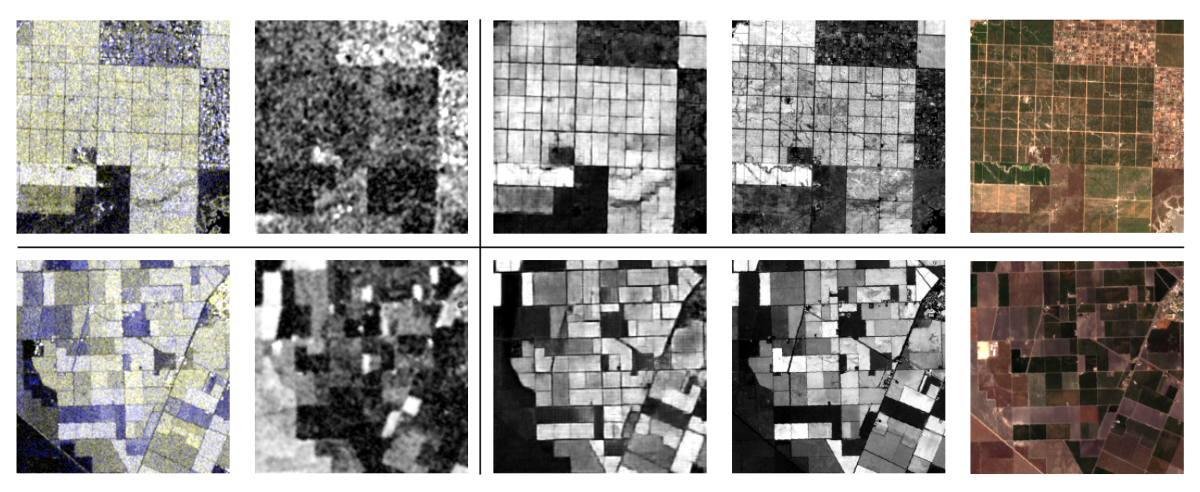
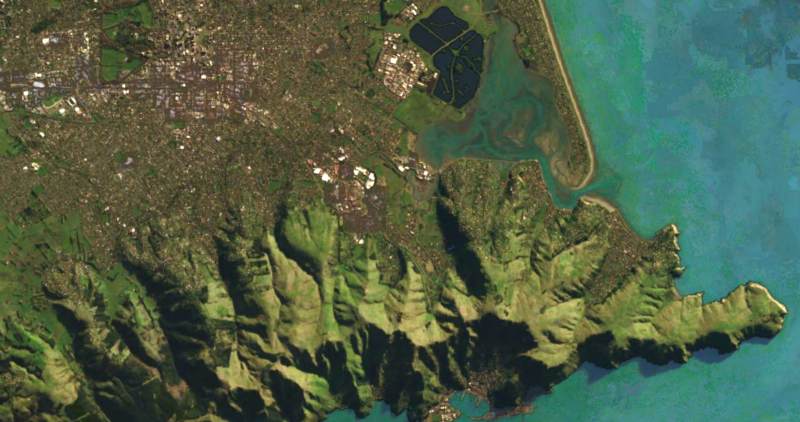
Using all imagery collected by Landsat 8, the jewel of NASA’s earth observation program, we’ve created a global RGB composite. We’ve mitigated the effects of haze by converting to “surface reflectance” units, and have pan-sharpened the image to 15-meter pixel resolution.
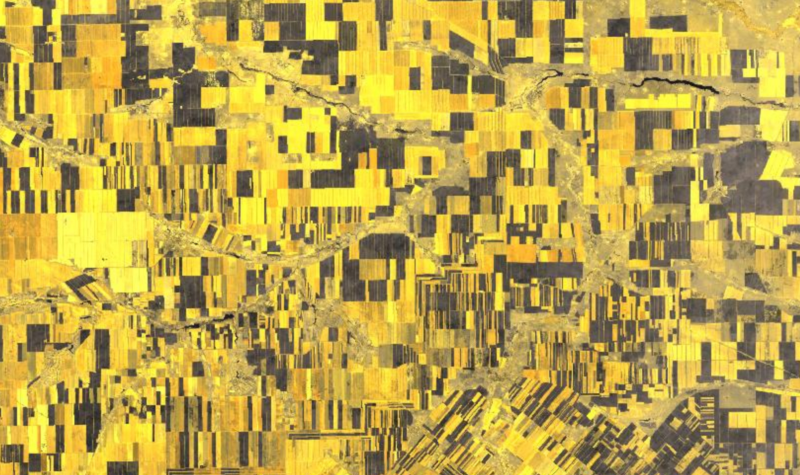
Launched just 18 months ago, Sentinel-2A is the European Space Agency’s (ESA) answer to Landsat 8. Using all Sentinel-2A data, we’ve produced a global composite image of the “Red Edge” bands. These bands of light sit between red and infrared, just beyond what humans can see, and they’re particularly sensitive to vegetative health. As far as we know, our Sentinel-2A composite is the first global Red Edge image.
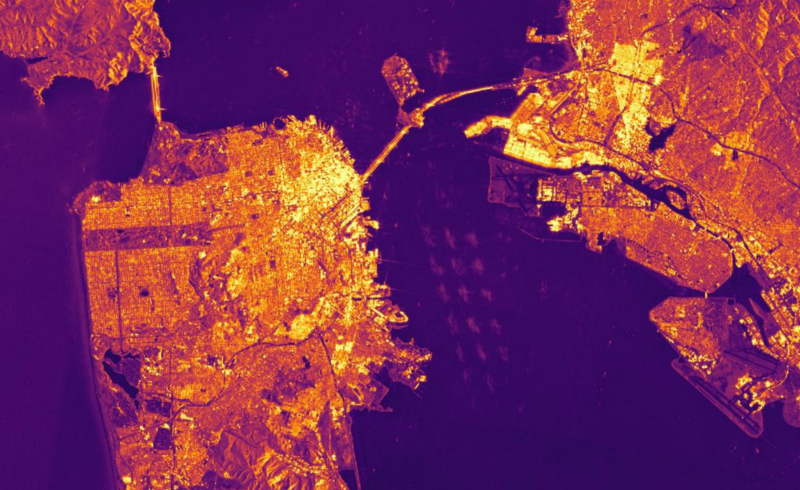
Finally, we’ve made a global composite using Sentinel-1, a pair of very unique satellites. Unlike most satellites, which passively observe reflected sunlight, Sentinel-1A and 1B actively illuminate the earth with radar and detect the reflected signal. The technology is known as Synthetic Aperture Radar (SAR), and the resulting images are particularly sensitive to manmade structures like buildings and ships. Another feature of SAR is that, because the wavelengths are long, SAR is able to penetrate and “see” through clouds. As far as we know, Descartes Labs has created the first global composite from Sentinel-1, and possibly the first global SAR image. The Sentinel-1 composite described here required multiple iterations, but each iteration only took about one hour of compute time.
The ability to make these composite images—to quickly experiment and iterate on a global-scale analysis—is made possible by the platform we’ve built at Descartes Labs. The main ingredients are:
The result is a nimble, highly scalable platform for geospatial data analysis. Creating a platform capable of processing a petabyte of geospatial data in a few hours is remarkable. On a more macro level, it means rapid iteration on global-scale problems will become commonplace, better positioning us to address some of the more fundamental problems facing the globe (like food production and scarcity, monitoring natural resource depletion, and so on).
We’re proud of what we’ve built and want to open it up to the world. In this spirit, we’re making our composites public and inviting developers to join the Descartes Labs community. If you’re excited about the possibilities of building a geospatial platform to create better models of human activity on the planet, check out our open positions. We’re hiring quickly and we’re looking for top scientists.
We’ll also be sharing more applications built with our platform this year. In the meantime, we encourage you to think about how you or your organization might use this platform, and as always, get in touch at hello@descarteslabs.com.