Article category: Science & Technology, Company News
Apply for Our Impact Science Program and Get Your Hands on...
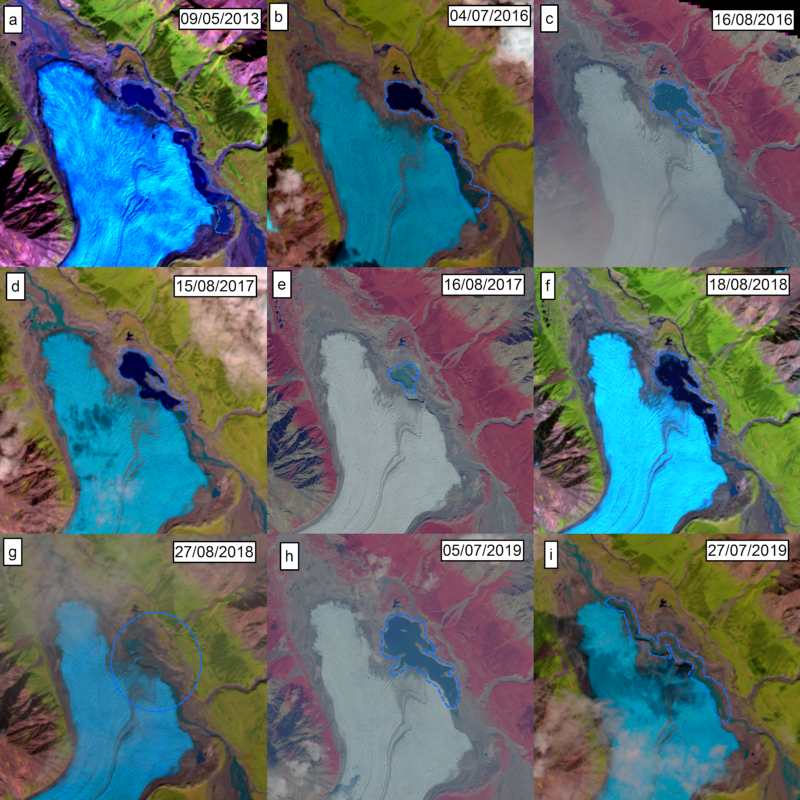
The Donjek Glacier has temporarily dammed the Donjek River multiple times during the last few...
Water plays many roles in our lives. At the most basic level, we need clean, safe, accessible drinking water each day. But we also use fresh water for cooking, sanitation, recreation, power storage and generation, and irrigation. Water, however, can be fickle. The location and availability of naturally-occurring fresh water varies with the weather, and is likely to change in the future due to human influence and the changing climate. We have long sought to tame rivers and stabilize our access to water through feats of engineering, leading to the construction of nearly 7,000 dams around the world.
Today, we have an additional tool at our disposal: massive amounts of satellite imagery and the compute power to process it, which gives us the ability to monitor water availability worldwide.
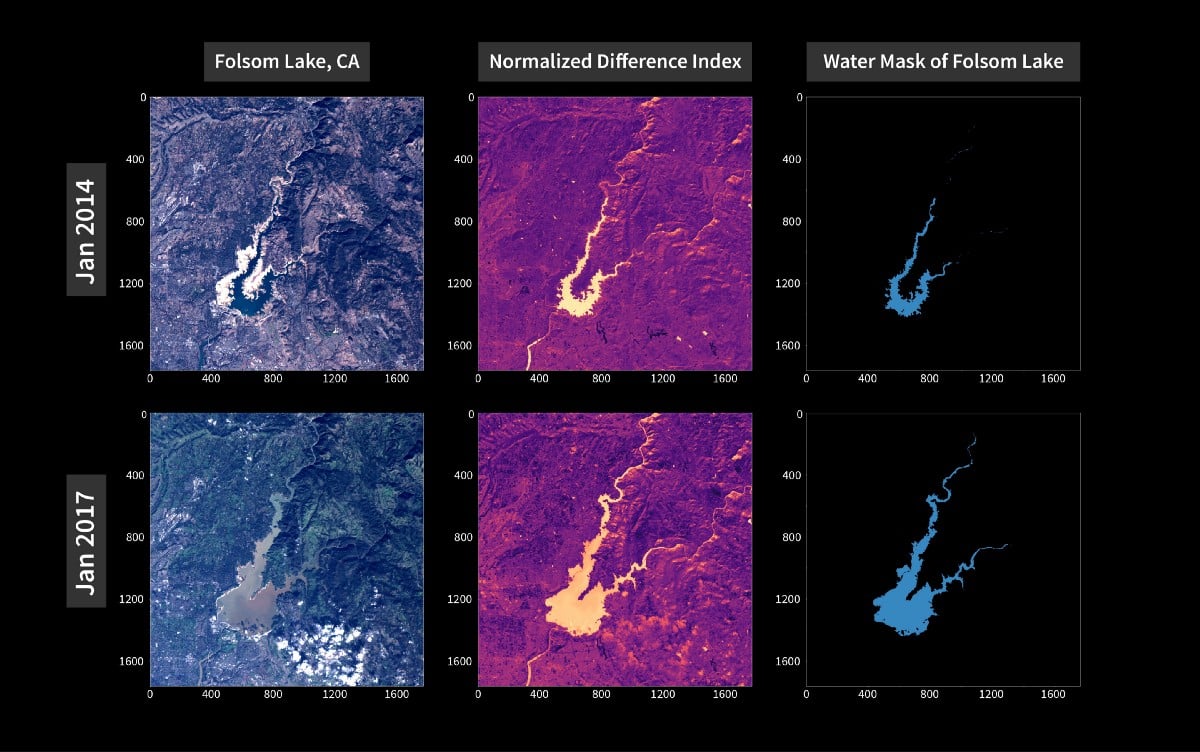
Here at Descartes Labs, we have developed a platform for geospatial analysis that allows our scientists to easily access petabytes of satellite imagery in order to build models using machine learning and artificial intelligence tools. At first glance, mapping and monitoring water might seem easy—just look for the blue pixels, right? But the reality is much more complex: water can appear blue, brown, green, or black depending on the light and its level of dirt or algae. And some things that are not water, like shadows, can share similar spectral characteristics to water.
To build our water model, we sampled over half a million 30-meter pixels from around the world and across Landsat missions 4 through 8, and Sentinel 2, spanning 1984 to the present. Using the publicly available water occurrence dataset as our “ground truth,” we trained a boosted random forest model to predict the probability of water. In addition to six native bands of the satellites (red, green, blue, near infrared, shortwave infrared 1&2), we used two transformations into hue-saturation-value space, as well as normalized differences like the normalized difference water index (NDWI). Finally, we employed high-resolution slope information, which helped us distinguish terrain shadows from water. Because clouds often obscure our view of the ground, we combined our predictions for each image across three-month seasons (e.g. March, April, and May) to produce a quarterly water mask.
Once our model was trained, it was time for the fun part: deploying it at scale! We chose to focus on about a dozen interesting dams and reservoirs across the world, as well as the continental United States as a whole. The latter task is truly one of “big data”: the continental United States has a surface area of over 8 million square kilometers, which corresponds to nearly 9 trillion 30-meter pixels—and we were looking over a period of 34 years. Thanks to the hard work of our software engineering team, however, it was possible to perform this feat in not much longer than a weekend by spinning up thousands of computers in the cloud at a time, and sending a subset of the imagery to each computer. In the end, our models crunched more than 100 terabytes of satellite imagery across millions of machines in the Google cloud.
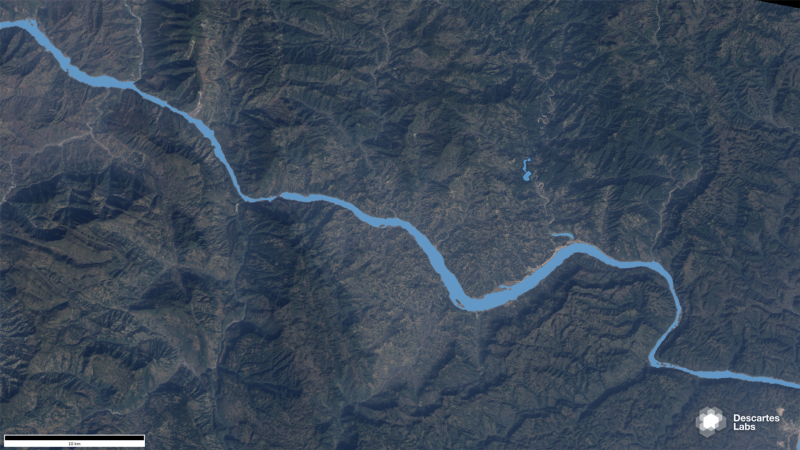
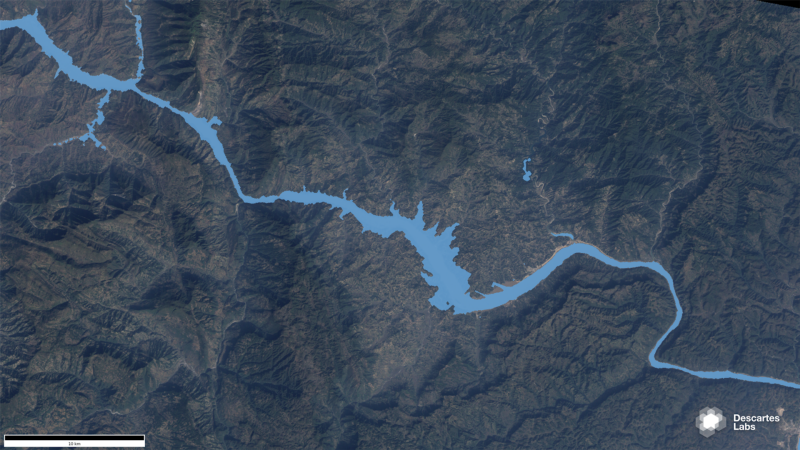
By peering into the past through historical satellite imagery, we can get a front-row view of some dramatic changes to water bodies over time. For instance, we can see the natural progression of the Yangtze River in Hubei, China in 1987 based on Landsat 5 data (below, water mask shown in light blue). The landscape was dramatically altered after the installation of the Three Gorges Dam, which led the Yangtze to extend beyond its original banks and flood parts of the surrounding mountainous landscape. While the dam provides an enormous amount of non-fossil fuel energy for China, the large changes that we can see from the satellite imagery had even larger impacts on the ground: 1.3 million people were displaced from their homes to allow for the inundation of the reservoir, and its construction has led to an uptick in massive landslides that risk injury to people and infrastructure.
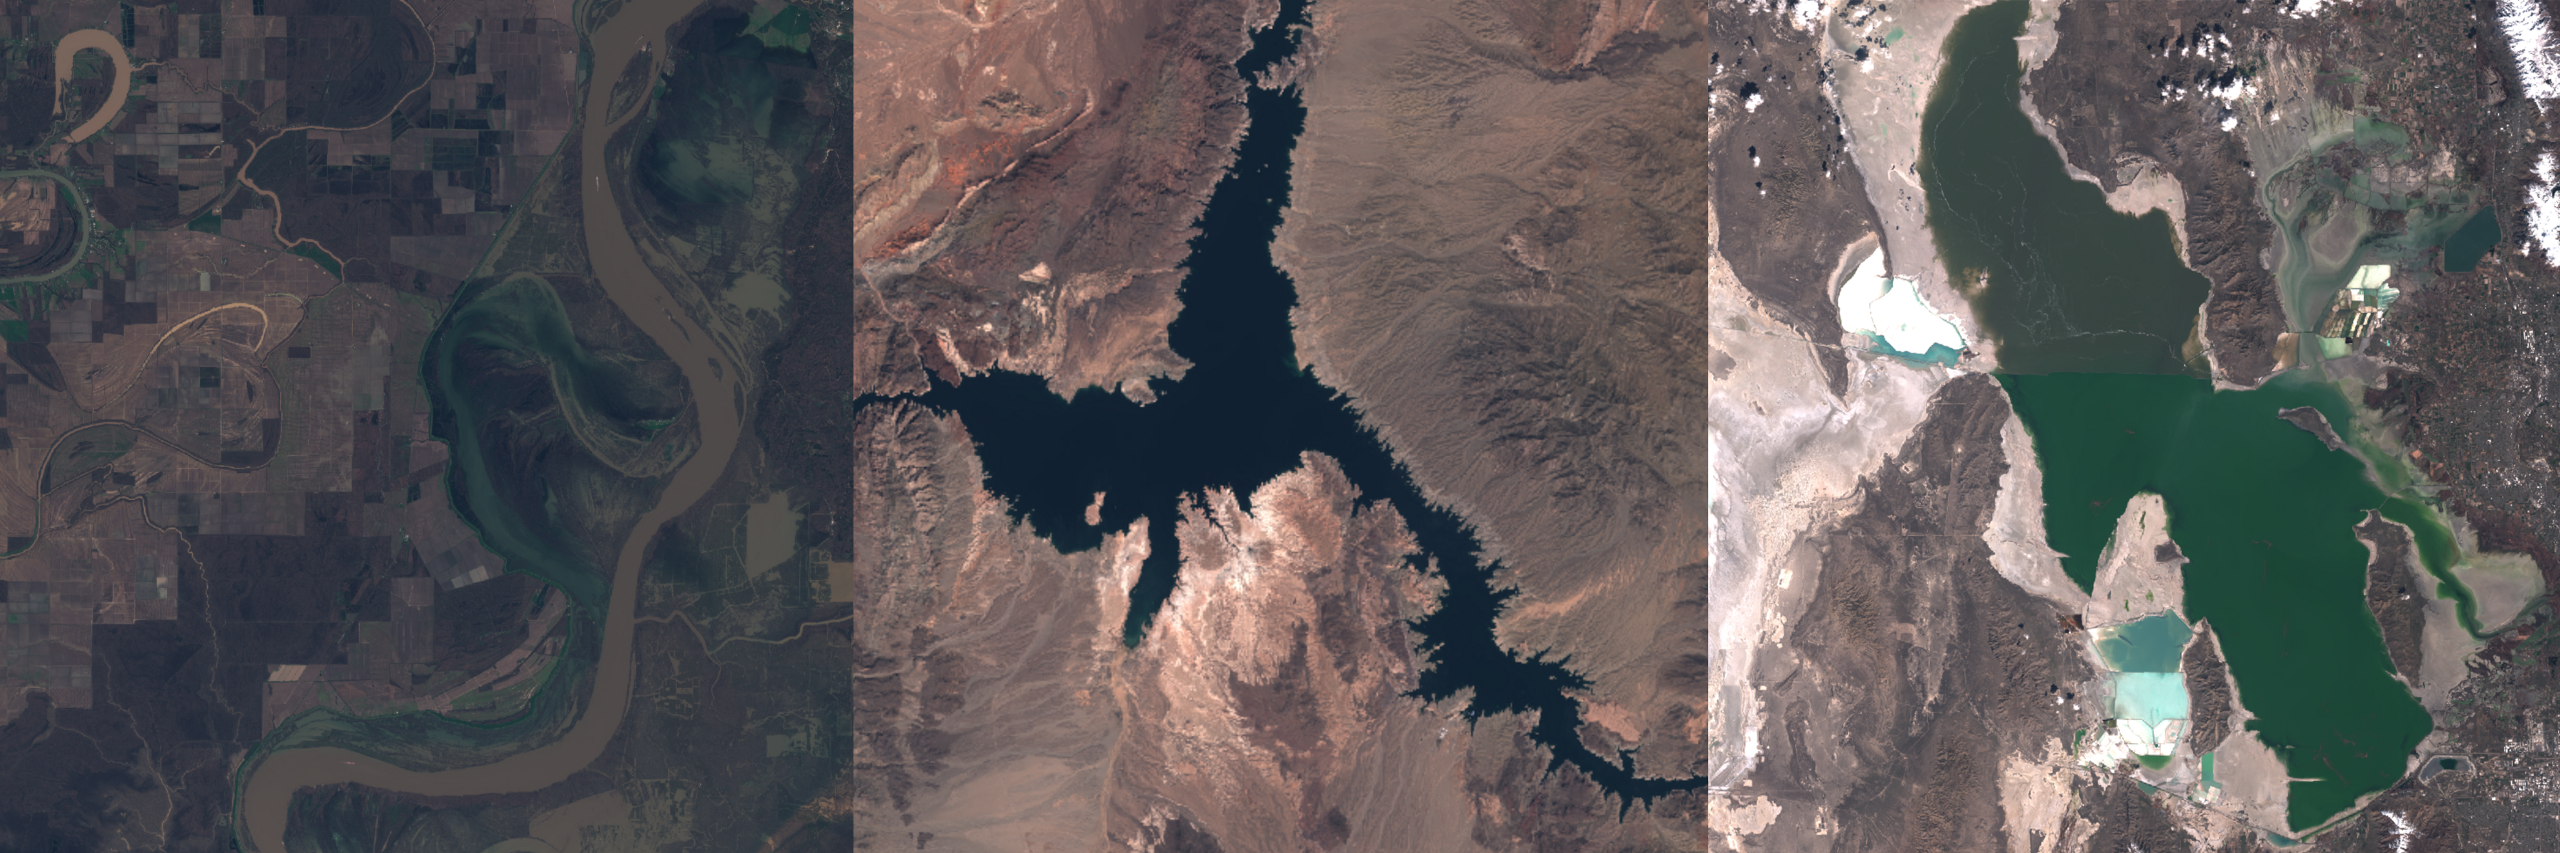
We can also examine more rapid changes in surface water. Spain has experienced a major drought over the past two years, due to the combination of low precipitation and high temperatures. Many of the reservoirs that provide water for agriculture have reached dramatically low levels—in some cases exposing the original cities that were flooded when creating the dams, a reminder of the human impact of dam building. Using satellite imagery, we can watch as one reservoir along the Duero River, the Almendra, recedes from March 2016-November 2017. This is not, however, the first time that the Almendra Reservoir has shrunk to these low levels: we can see similar behavior in imagery from the late 1980s and early 2000s.
Finally, let’s zoom out to look at the big picture—the really big picture. After applying our water mask to the full continental United States, we can begin to understand how surface water changes over seasons and years. Watch as lakes and rivers fill up with spring rains and snowmelt, then die down again over dry summers, or as the salt flats west of the Great Salt Lake flood and dry out again.
These visualizations are just the beginning: with this algorithm and dataset, we can ask and answer important questions about how water availability is changing with human use and the weather at large spatial scales.
To address the environmental challenges that we increasingly face, we first must actively measure and monitor our natural resources—and then make the necessary global, regional, and local changes to protect them. For the first time, we can do so with a global view through the use of satellite data. The information we glean from our analyses can help us understand, for example, whether a water shortage is related to local weather and use variability, or indicative of a larger, continental-wide trend. The answers to questions like these are not only of scientific interest, but also critical for governments, nongovernmental organizations, and businesses who are committed to building a more sustainable future.
Just as it is possible to use our massive trove of satellite data and computational power to track global supply chains and estimate agricultural yields, we are also committed to monitoring our precious natural resources. Increased transparency and improved measurements are critical first steps toward the development of policies that will ensure that we all have a water-secure future.
Curious to learn more about how this was done? Contact us at sales@descarteslabs.com, or if you’re interested in joining Descartes Labs and changing the way we see our world check out our open positions here.