Article category: Consumer Goods, Company News
ClearSky: A Cloud-Free View of the Planet
We’re excited to announce a new partnership with Aspia Space to power its ClearSky product offering...

As some of you might know, in January I joined Descartes Labs. As a company, one of our goals is to make spatial data more readily available and to make it easier to go from observations to actionable insights. In a way, just like Tableau, we’d like people to see and understand their data but our focus is on sensor data whether it is remote such as satellite or drone imagery, video feeds or in-situ such as a weather station data. And when we talk about big data we mean many Petabytes being processed using tens of thousands of CPU or GPU cores.
But at a high level, many common data problems that you’d experience with databases or Excel spreadsheets apply just the same. For example, it is hard to find the right data, there are inconsistencies and data quality issues which become more obvious when you want to integrate multiple data sources.
Sounds familiar?
We built a platform that aims to automatically address many of these issues, what one might call a Master Data Management (MDM) system in enterprise data management circles but focusing on sensor data. For imagery, many use cases from creating mosaics to change detection and various other deep learning applications require these data corrections for best results. And having an automated system shaves off what would otherwise be many hours of manual data preparation.
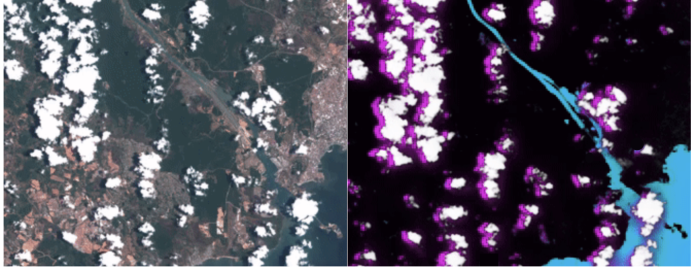
For example to use more than two images in an analysis, the multiple images have to be merged into a shared data space. The specific requirements of the normalization is application dependent, but often requires that the data be orthorectified, coregistered, and their spectral signatures normalized, while also accounting for interference by clouds and cloud shadows. We use machine learning to automatically detect clouds and their shadows hence can filter them out on demand, an example of which you can see below.
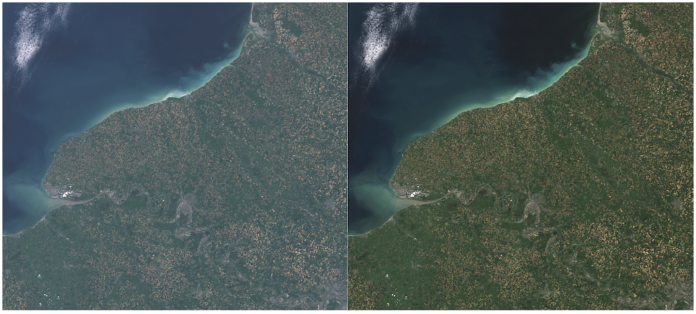
However, to truly abstract satellite imagery to an information layer, analysts must also account for a variety of effects that distort the satellite observed spectral signatures. These spectral distortions have various causes that include geographic region, time of year, differences in the satellite hardware, and the atmosphere.
The largest of these effects is often the atmosphere. Satellites are above the atmosphere looking down and, therefore, mix the sunlight reflected from the surface with that scattered by the atmosphere. The physical processes at play are similar to why the sky is blue when we look up.
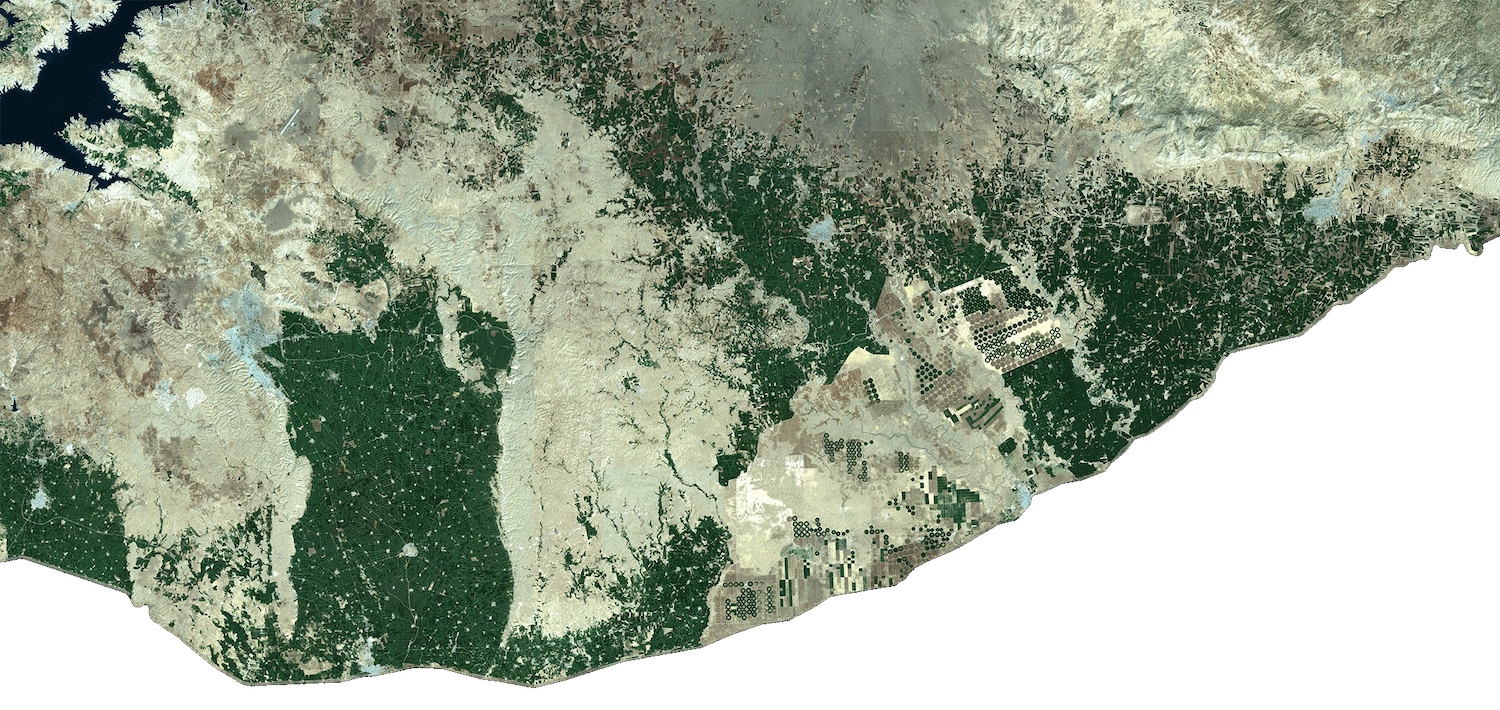
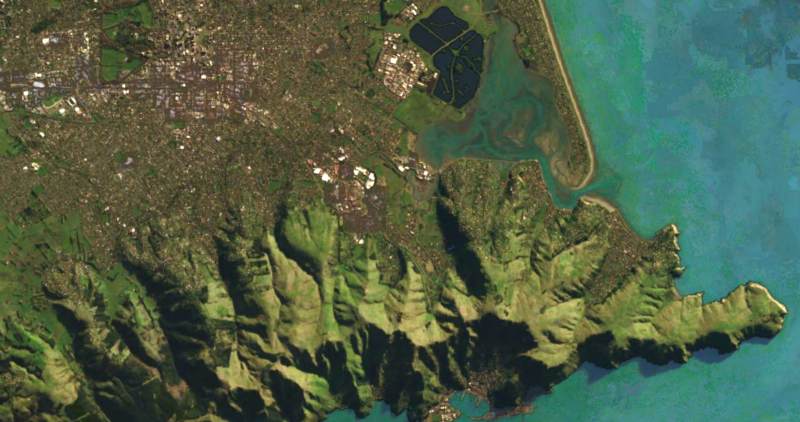
The process of estimating and removing these effects from satellite imagery is referred to as atmospheric correction. Once these effects are removed from the imagery, the data is said to be in terms of “surface reflectance”. This brings satellite imagery into a spectral space that is most similar to what humans see every day on the Earth’s surface.
By putting imagery into this shared spectral data space, it becomes easier to integrate multiple sources of spectral information — whether those sources be imagery from different satellites, from ground based sensors, or laboratory measurements.
We take a different tact than other approaches to surface reflectance in that our algorithms are designed to be a base correction that is applicable to any optical image. Other providers of surface reflectance data often focus on their own sensors and their own data, sometimes making it more difficult for users of multiple sensors to integrate the otherwise disparate observations.
We have already preprocessed, staple data sources such as NASA’s Landsat 8 and European Space Agency (ESA)’s Sentinel-2 data. This includes all global observations for the lifespan of the respective satellites. We also generate scenes for other optical sensors, including previous Landsat missions, on request. In addition to our own algorithms, we also support USGS’ (LaSRC) and ESA’ (Sen2Cor) surface reflectance data.
If you’re into serious geospatial analysis you should definitely give our platform a try and see for yourself. If you’re not but know someone who does, spread the word! With our recently launched platform, we are very excited to help domain experts get to insights faster by helping them find the right datasets, smartly distribute their computations across thousands of machines, and reduce the burden of dealing with data quality issues and the technical nuances of satellite data.
You can read more about different ways you can use surface reflectance correction on our platform here.