Article category: Science & Technology, Company News
Descartes Labs Government Accelerates Mission-Ready...
Descartes Labs Government selected EarthDaily Analytics as a supplier for their Earth observation...

In February of 2015, after years of delays (including seven that saw the project literally sitting in storage), SpaceX launched NOAA’s first operational deep-space satellite, the Deep Space Climate Observatory (DSCOVR).
Onboard DSCOVR is an instrument fixed on the sun with a primary task of warning Earth of solar magnetic storms, and two sensors fixed on Earth, EPIC and NISTAR. EPIC is used for measuring ozone, aerosols, cloud and vegetation properties, and UV radiation on the earth’s surface. NISTAR measures the outgoing radiation from the earth to help us understand our planet’s radiation budget.
Most of the satellite imagery we see in the news, on national park placards or in our Twitter feeds is collected by cameras that orbit the earth in a geocentric, sun-synchronous orbit. Basically, these satellites whip around Earth, south to north and north to south, and observe places on the planet at roughly the same time of day (or night) at a regular interval. (Landsat 8’s revisit rate is 16 days, for example.) Others, like the GOES satellites, are also geocentric, but they are geostationary, meaning they sit in space, parked directly above a specific place on earth. GOES 16 sits about 22,000 miles above this spot in Colombia.
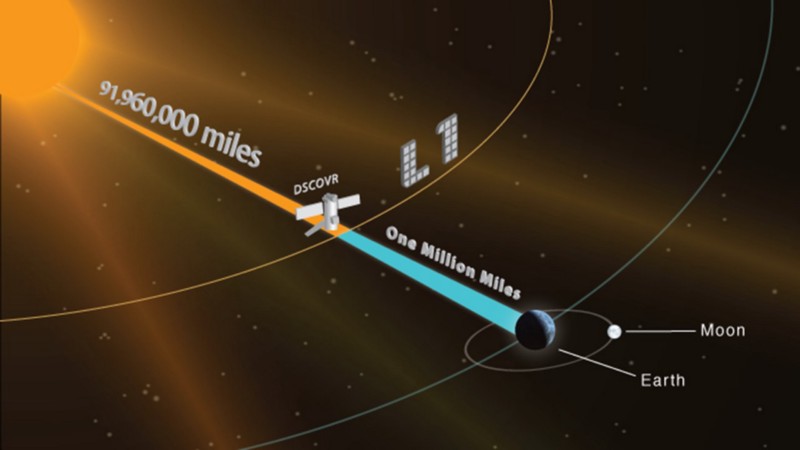
DSCOVR is not like most satellites. It isn’t geocentric—it’s heliocentric, permanently fixed on the sun (and the sun-side of earth). And it’s not so close to earth; it’s parked nearly 1,000,000 miles away, at the L1 Lagrange point, where the gravitational forces of Earth and the Sun on the objects sitting there are more or less equal. Nearly everything about DSCOVR is unique, which makes it a perfect candidate for a little visual experimentation.
Descartes Labs is always looking for new and useful datasets that might give us an edge in our analytics or help flesh out our ever-growing data product catalog. Currently the catalog contains 70 “core” raster products, which are actively curated by our internal satellite ingest team. The “core” products span 23 unique sensors and even include some non-traditional remote sensing data such as weather reanalyses and forecasts. Our applied science team plays a critical role in the discovery process that expands our data catalog. As they encounter occasional roadblocks in their work, a novel dataset can push that work forward. Sometimes the data discovery process leads us to truly wacky sensors and sensor platforms—as was the case with DSCOVR!
DSCOVR stays on the sunlit side of our planet, so a time series of consecutive images taken from its vantage point beautifully visualizes the Earth’s rotation in a fun and quirky way. We explored alternative visualizations of this rotation by using different map projections that resulted in a set of genuinely extraordinary views of Earth. We started with common global projections like Plate Carrée and Equal Earth and eventually tried some more eccentric representations of our globe.
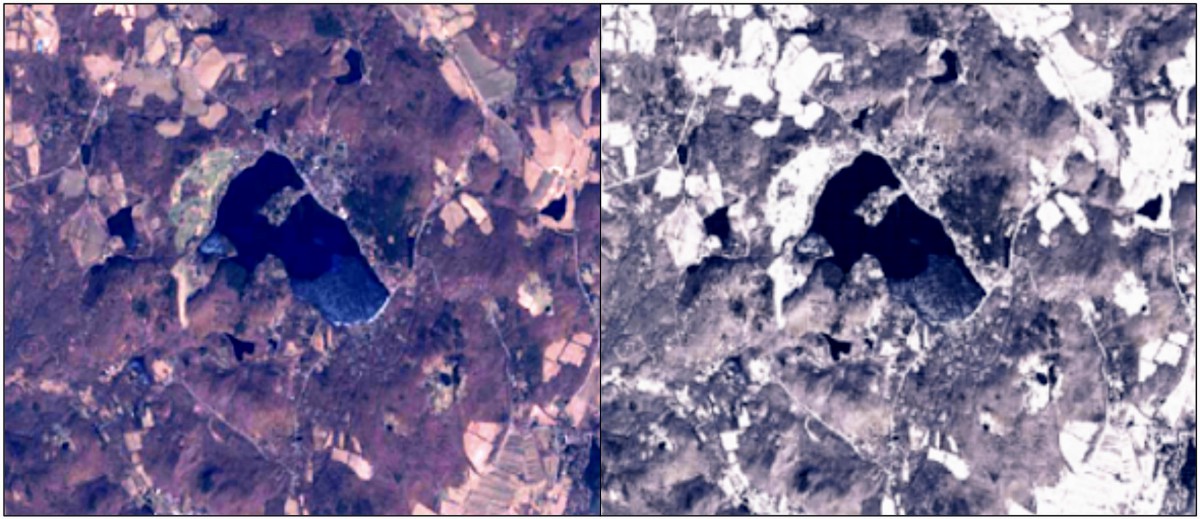
Here’s an example. The top two images are the raw data, in false color vegetation (left) and true color (right), while the bottom two images have been reprojected and resampled to Plate Carrée, resulting in what looks like a series of rolling earth cylinders. The rotation of the earth in the bottom images can be described as a semi-rectangular field of view (think airplane window) passing over an image of the earth. One advantage of visualizing DSCOVR data this way is that the motion of clouds is clearer than it is in the raw imagery. The rotation of the earth in the raw imagery distracts from most of the motion you would otherwise see in large weather systems.
Additional representations of the rotation can be seen when using the Interrupted Goode Homolosine or Lagrange projections. In both these projections the rotation manifests as a wave across the frame.
Some of the projections we tested look completely alien. The Azimuthal Equidistant projection resembles an ominous black orb expanding and contracting. This orb corresponds to the side of the earth that DSCOVR isn’t seeing.
Laughs aside, DSCOVR is useful for more than creating goofy videos. The EPIC sensor has four UV bands and two near-IR bands. The UV bands are useful for tracking various trace gases and particulates in the atmosphere. NASA provides several derivative products for EPIC including sulfur dioxide (SO₂), ozone (O₃), and aerosols. The O₃ product can be used to show the seasonal expansion and contraction of the ozone hole over the Antarctic.
As Descartes Labs continues to grow our catalog and our applied scientists are charged with solving more and more unique problems, we will find new uses for data of all kinds, novel and unusual. Tinkering with DSCOVR data is just one small example of the experimentation that goes on every day at Descartes Labs—but it sure is a fun one!
Post script: Some outtakes and laughs from this process: