Article category: Consumer Goods
Creating Actionable Intelligence for the Oil & Gas Sector...
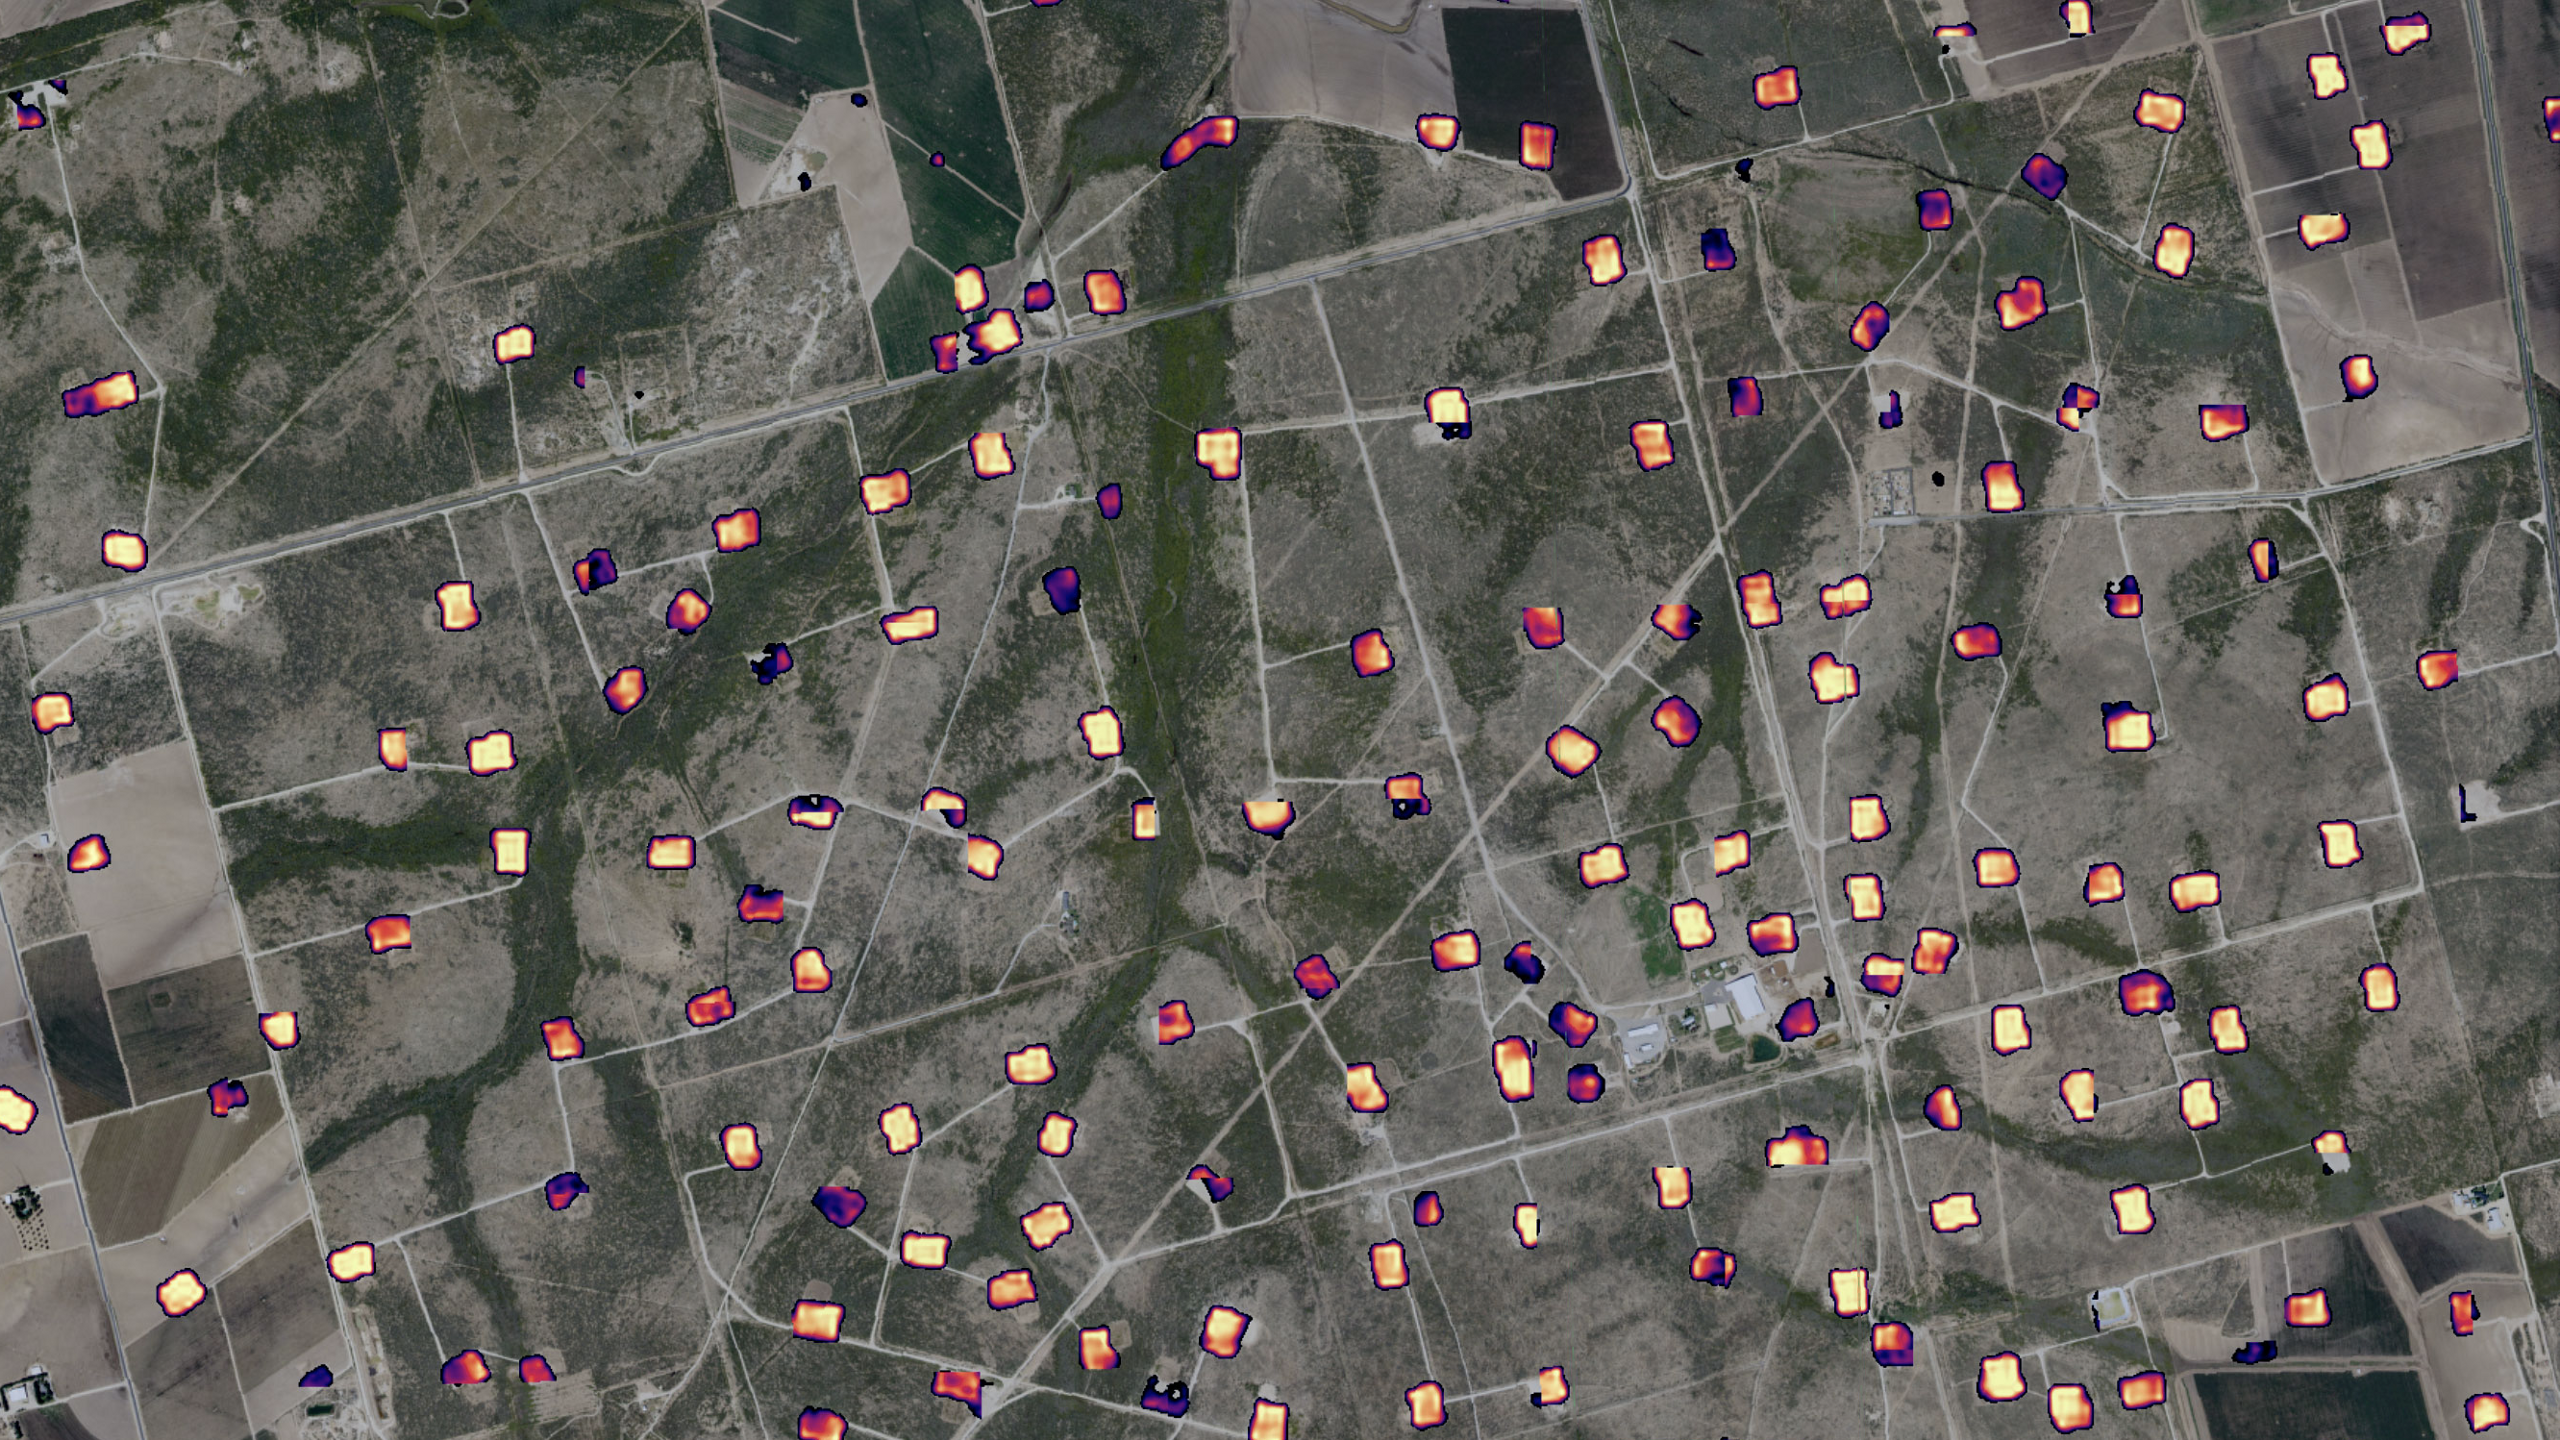
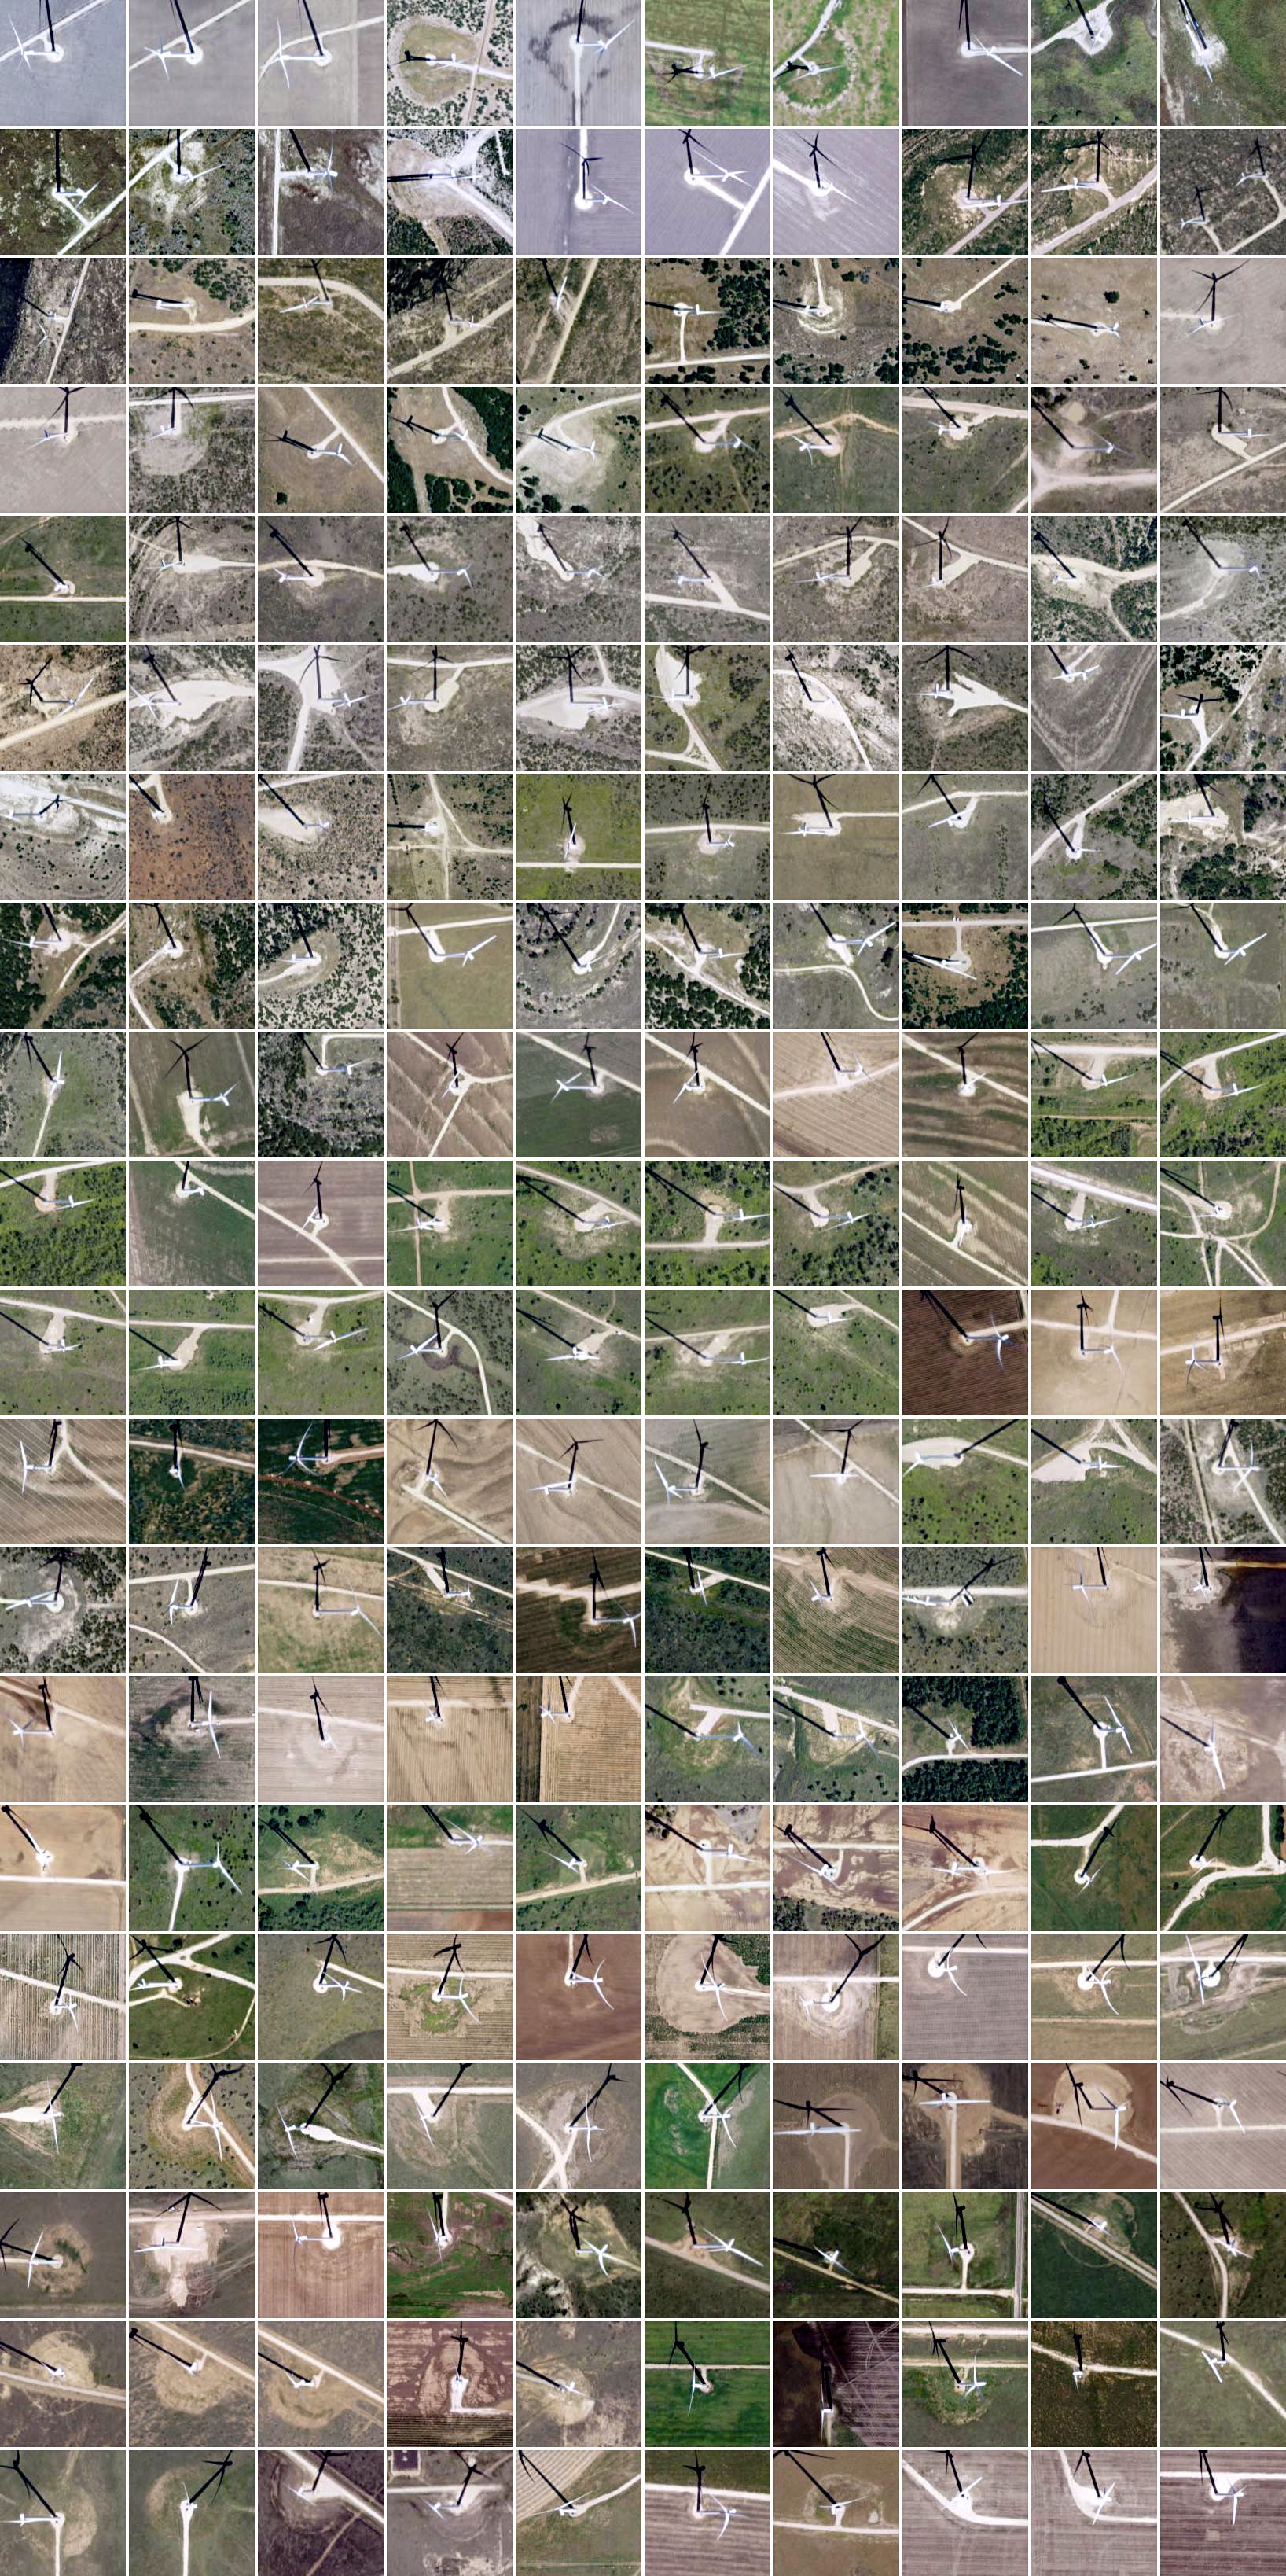
The probability output of a deep learning computer vision model which detects and segments well...
If Texas leads the nation in energy production (and it does, by quite a lot), McCamey could be its microcosm. This community of roughly 2,000 people is located at the cross section of three enormous energy sources:
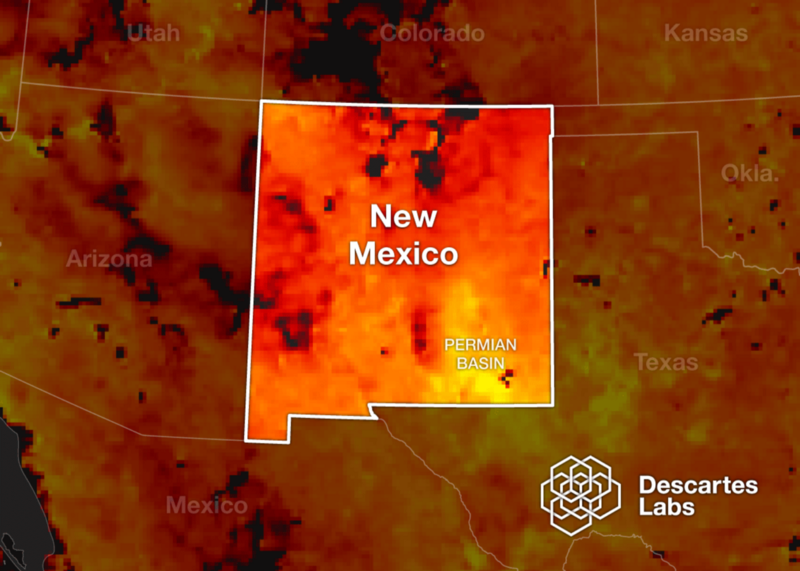
The Permian Basin, a massive oil field experiencing its biggest boom in decades.
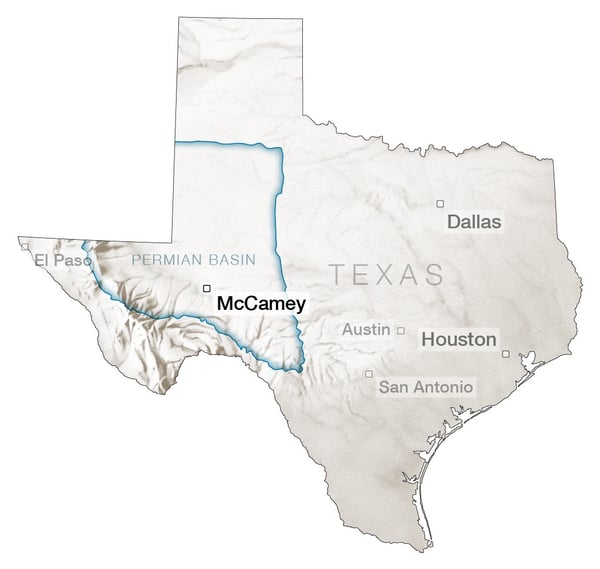
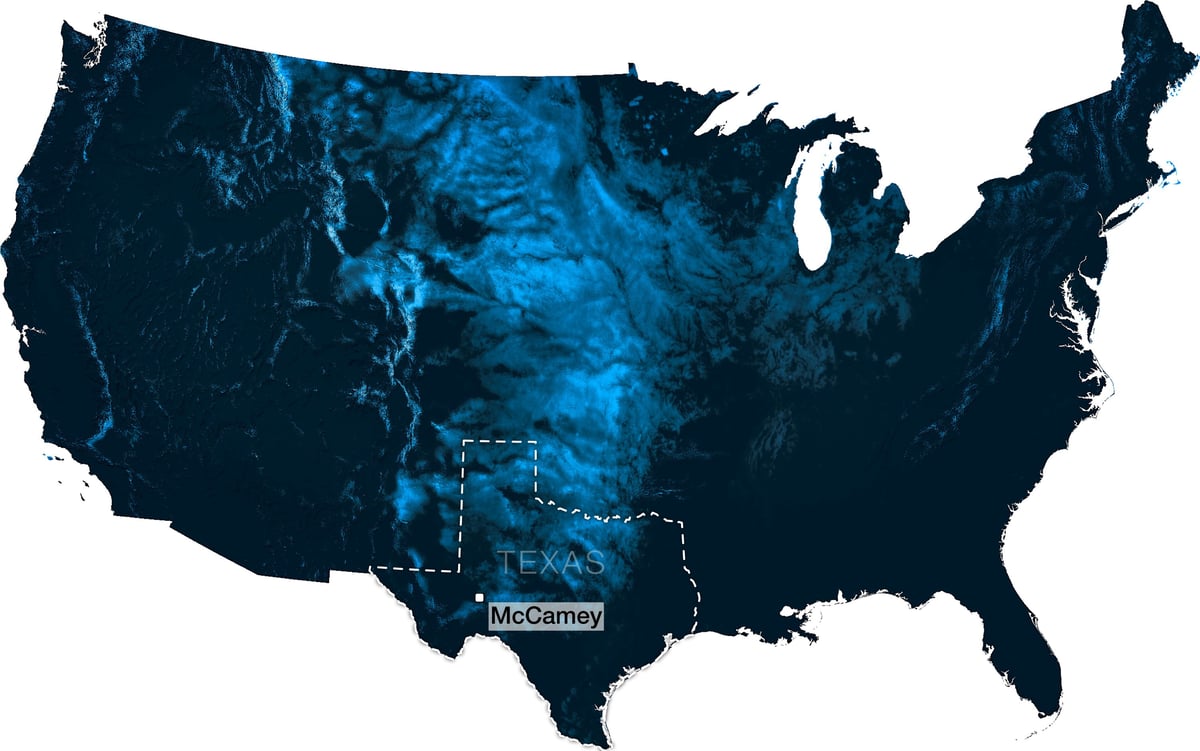
The Great Plains, an intensely windy region of the U.S.
The Sun Belt, the sunniest region of the U.S. (and West Texas is in a really sunny part of it!).
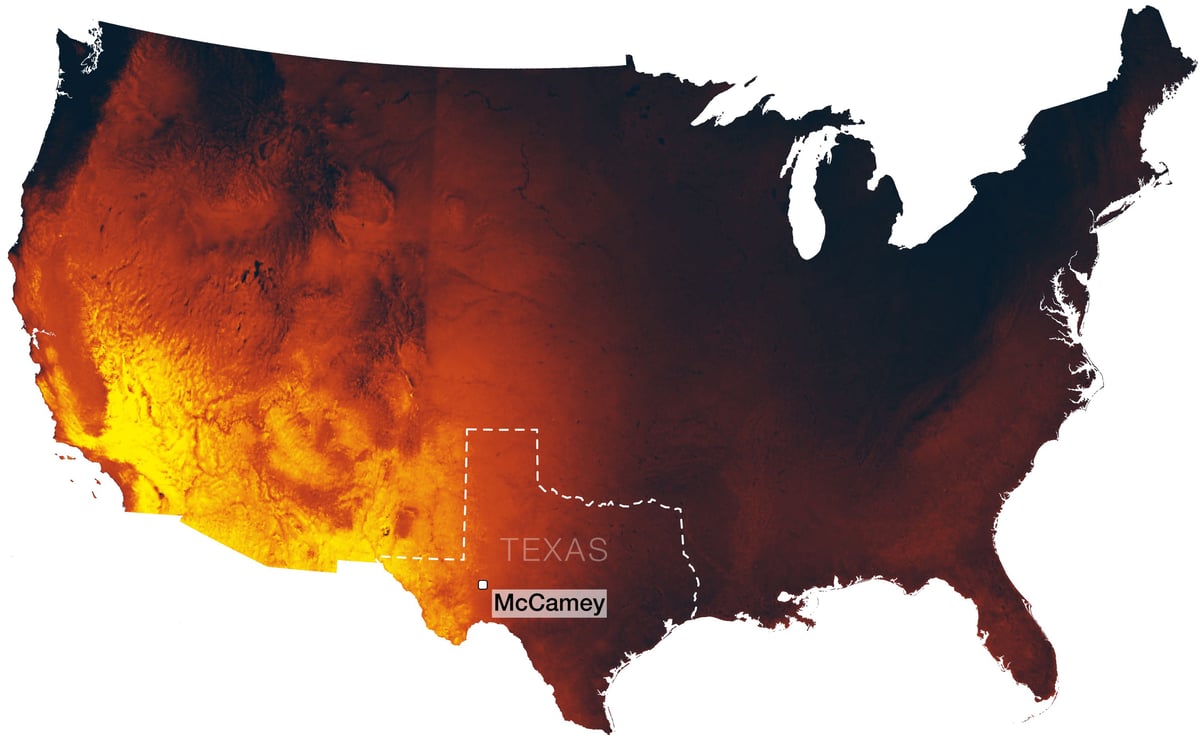
The image of McCamey, TX at the top shows a patch of earth being tapped for every last ounce of energy it has to offer. A new, several-square-mile solar farm that powers more than 56,000 residences — and is still under construction — is ringed by dozens of wind turbines (powering an additional 86,000+ homes) strategically placed on ridges nearby in a landscape strewn with oil and gas infrastructure. The area is overwhelmingly industrial and remote — Lubbock, the next closest city, is nearly 200 miles away.
Leveraging information both visible and invisible to the naked eye, Descartes Labs is using an array of earth observation satellites to track energy infrastructure development. Since the U.S. as a whole relies so heavily on Texas energy, developments in the state’s infrastructure have an impact on millions of people. In McCamey and throughout the state (particularly the western half), wind, solar, and oil and gas together make up the story of modern Texas energy production.
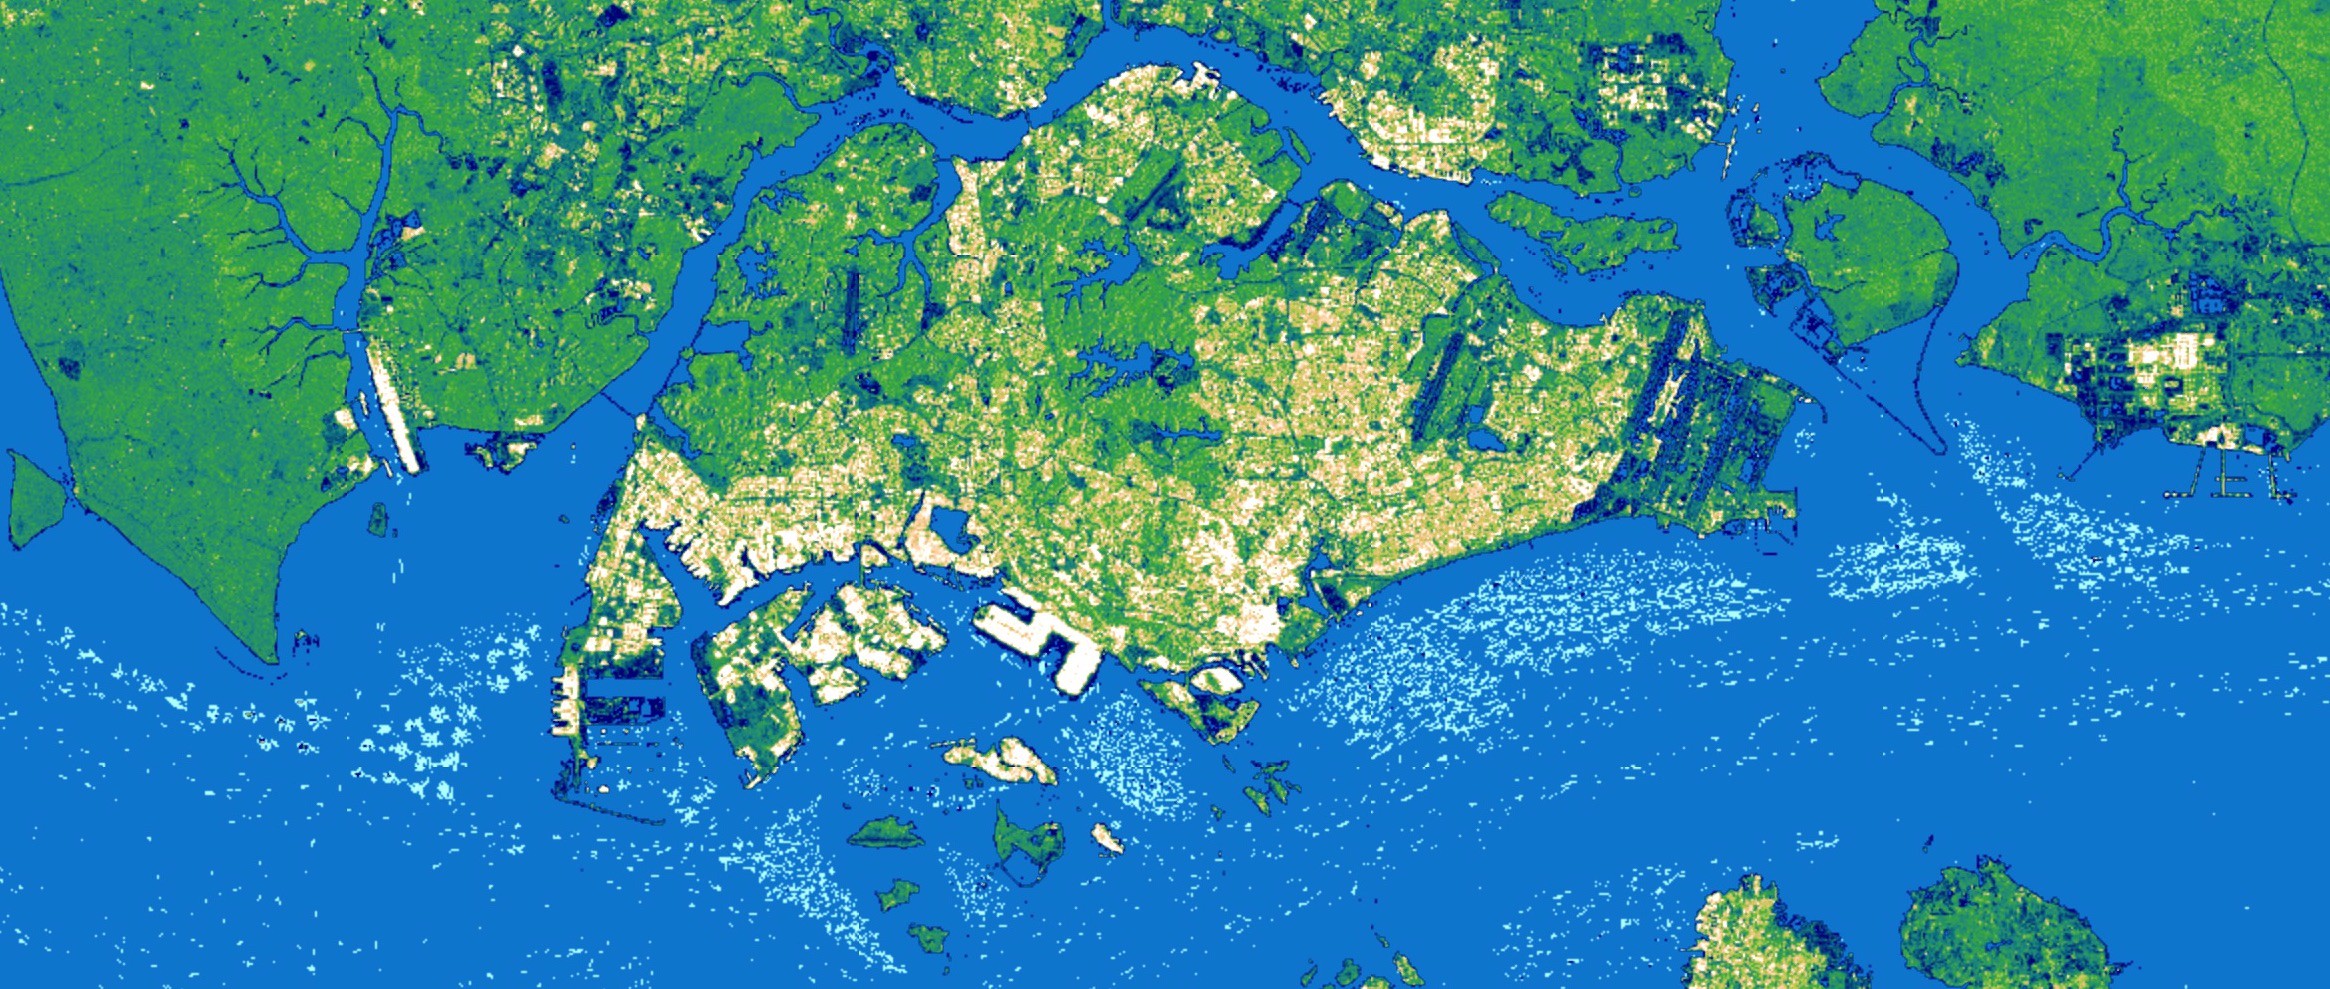
We mapped these three energy sources by applying deep learning computer vision models to satellite imagery. These models, trained with a diverse set of satellite image data, perform sophisticated pattern matching using neural networks to detect and delineate energy infrastructure. Using the Descartes Labs platform, which natively enables scalable cloud computing, we can train, iterate on, validate and deploy these models quickly and at a massive scale.
As an example, our oil and gas model can be run over Texas, a state approximately the size of Spain, from National Agricultural Imagery Program (NAIP) data at 1 meter resolution, in a matter of hours. What follows is a rundown of the culmination of multiple projects at Descartes Labs. Individually, each reveals the state’s success in a particular energy source, but together they illuminate a truly enormous and diverse energy powerhouse.

Wind power is booming in Texas. It accounts for about 15% of the electric grid; 12,000-plus turbines across the state produce more wind energy than any other state and since 2014, wind energy has outstripped output from the state’s two nuclear power plants. Only four countries create more wind energy than the state of Texas, and the development of new wind farms there isn’t slowing. Texas has more wind energy projects under construction than any other state.
Many of the wind turbines in Texas are concentrated in the northern and western parts of the state and on ridges or other areas of locally high elevation. But there are other sizeable wind farms scattered throughout the state, including the Los Vientos wind farm near McAllen and the Javelina wind farm near Loredo. As you can see in the image tiles above, wind turbines have been installed in a variety of landscapes. Wherever strong winds intersect with the power grid, there’s a chance a turbine will pop up.
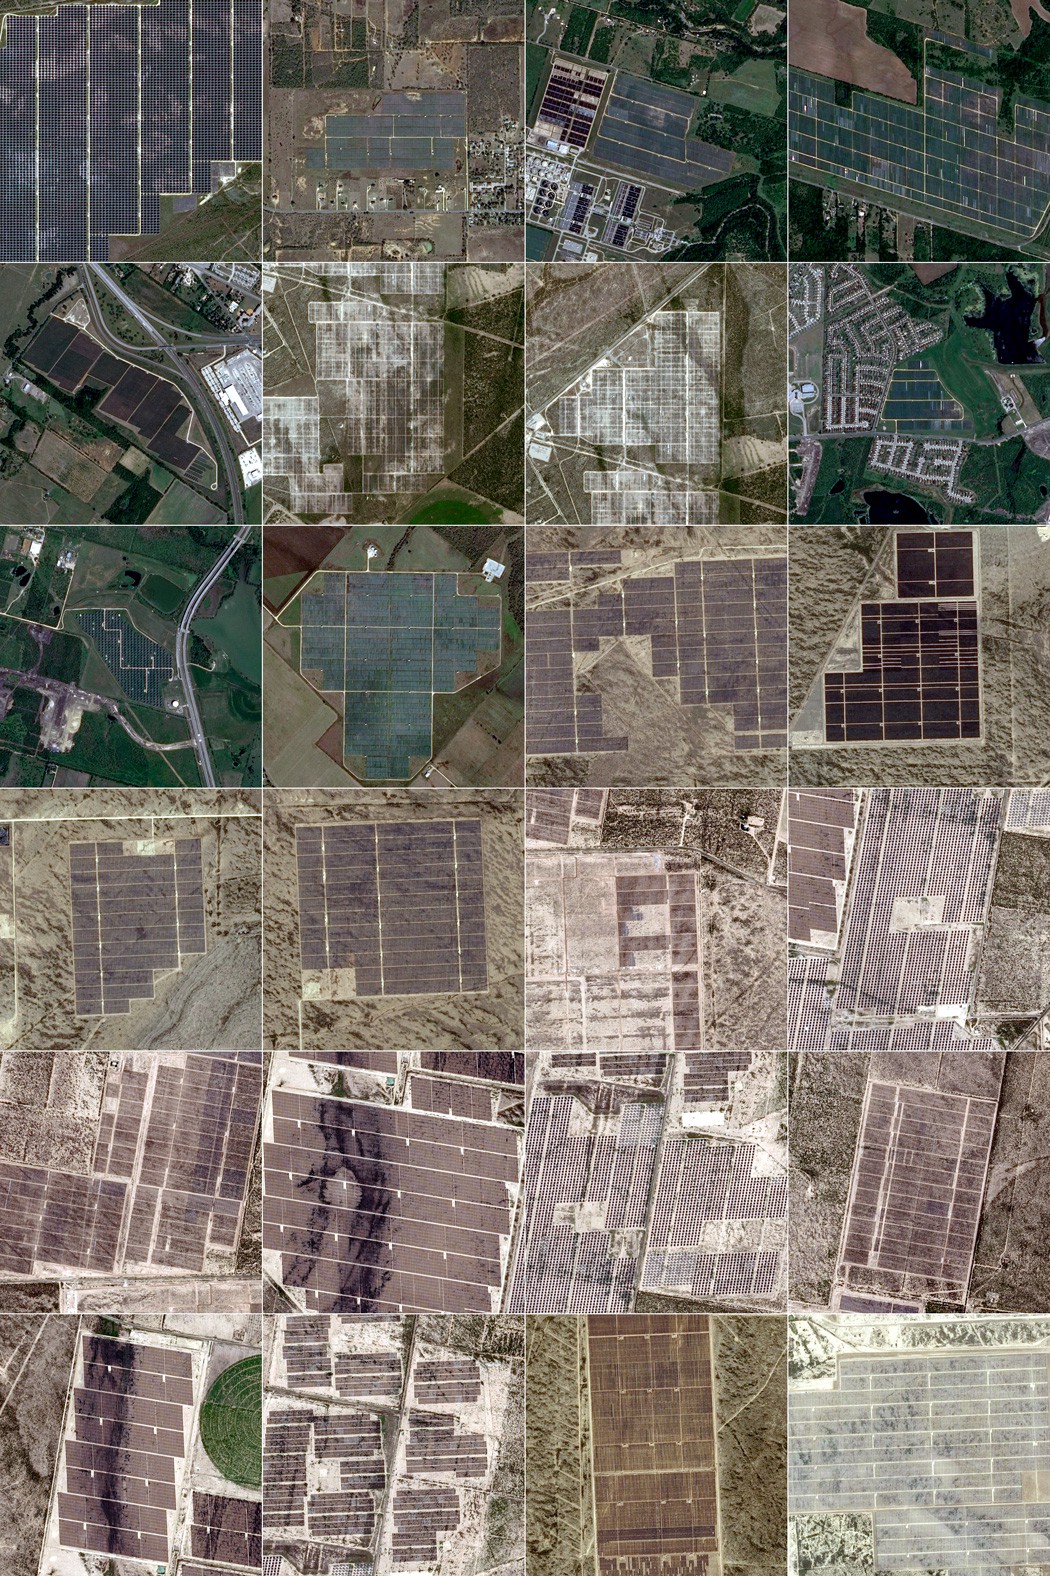
Unlike wind and oil and gas, which are comparatively better-established energy sources in Texas, solar development is more recent. Even so, while solar power currently accounts for less than 1% of total energy production in Texas, the state ranked #1 in solar energy potential and #7 in installed solar capacity in 2018. Energy production from solar has increased by more than five times since only four years ago, and is forecasted to quadruple by 2021.
In fact, researchers at Rice University found that patterns of wind and sunshine complement each other quite well in Texas. Wind energy there peaks at night, while the sun, of course, shines brightest during the day. This phenomenon is important because energy integration across multiple sources in Texas has historically been a challenge. As the state’s electric grid is largely isolated from others, nearly all transmission and load balancing must happen in-state. However, Texas leads the nation in energy consumption as well as production, and that demand is bolstering continued rapid growth in solar.
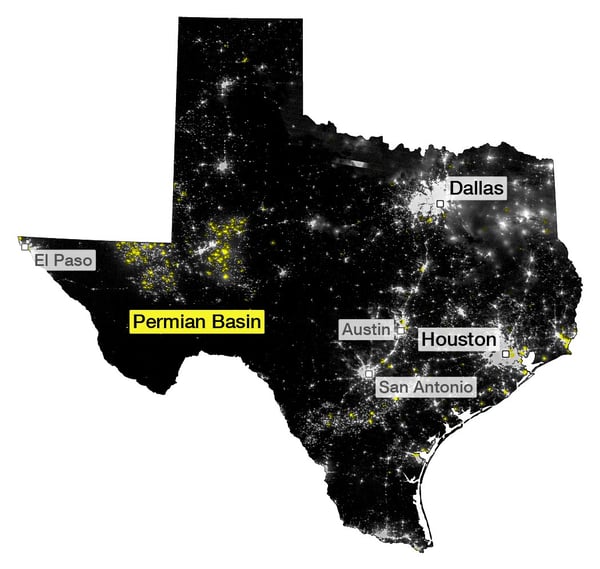
In 2017, Texas produced far more natural gas than any other state. In 2018, Texas set a new record for oil production, and more than doubled the amount produced in North Dakota, the next most productive state.
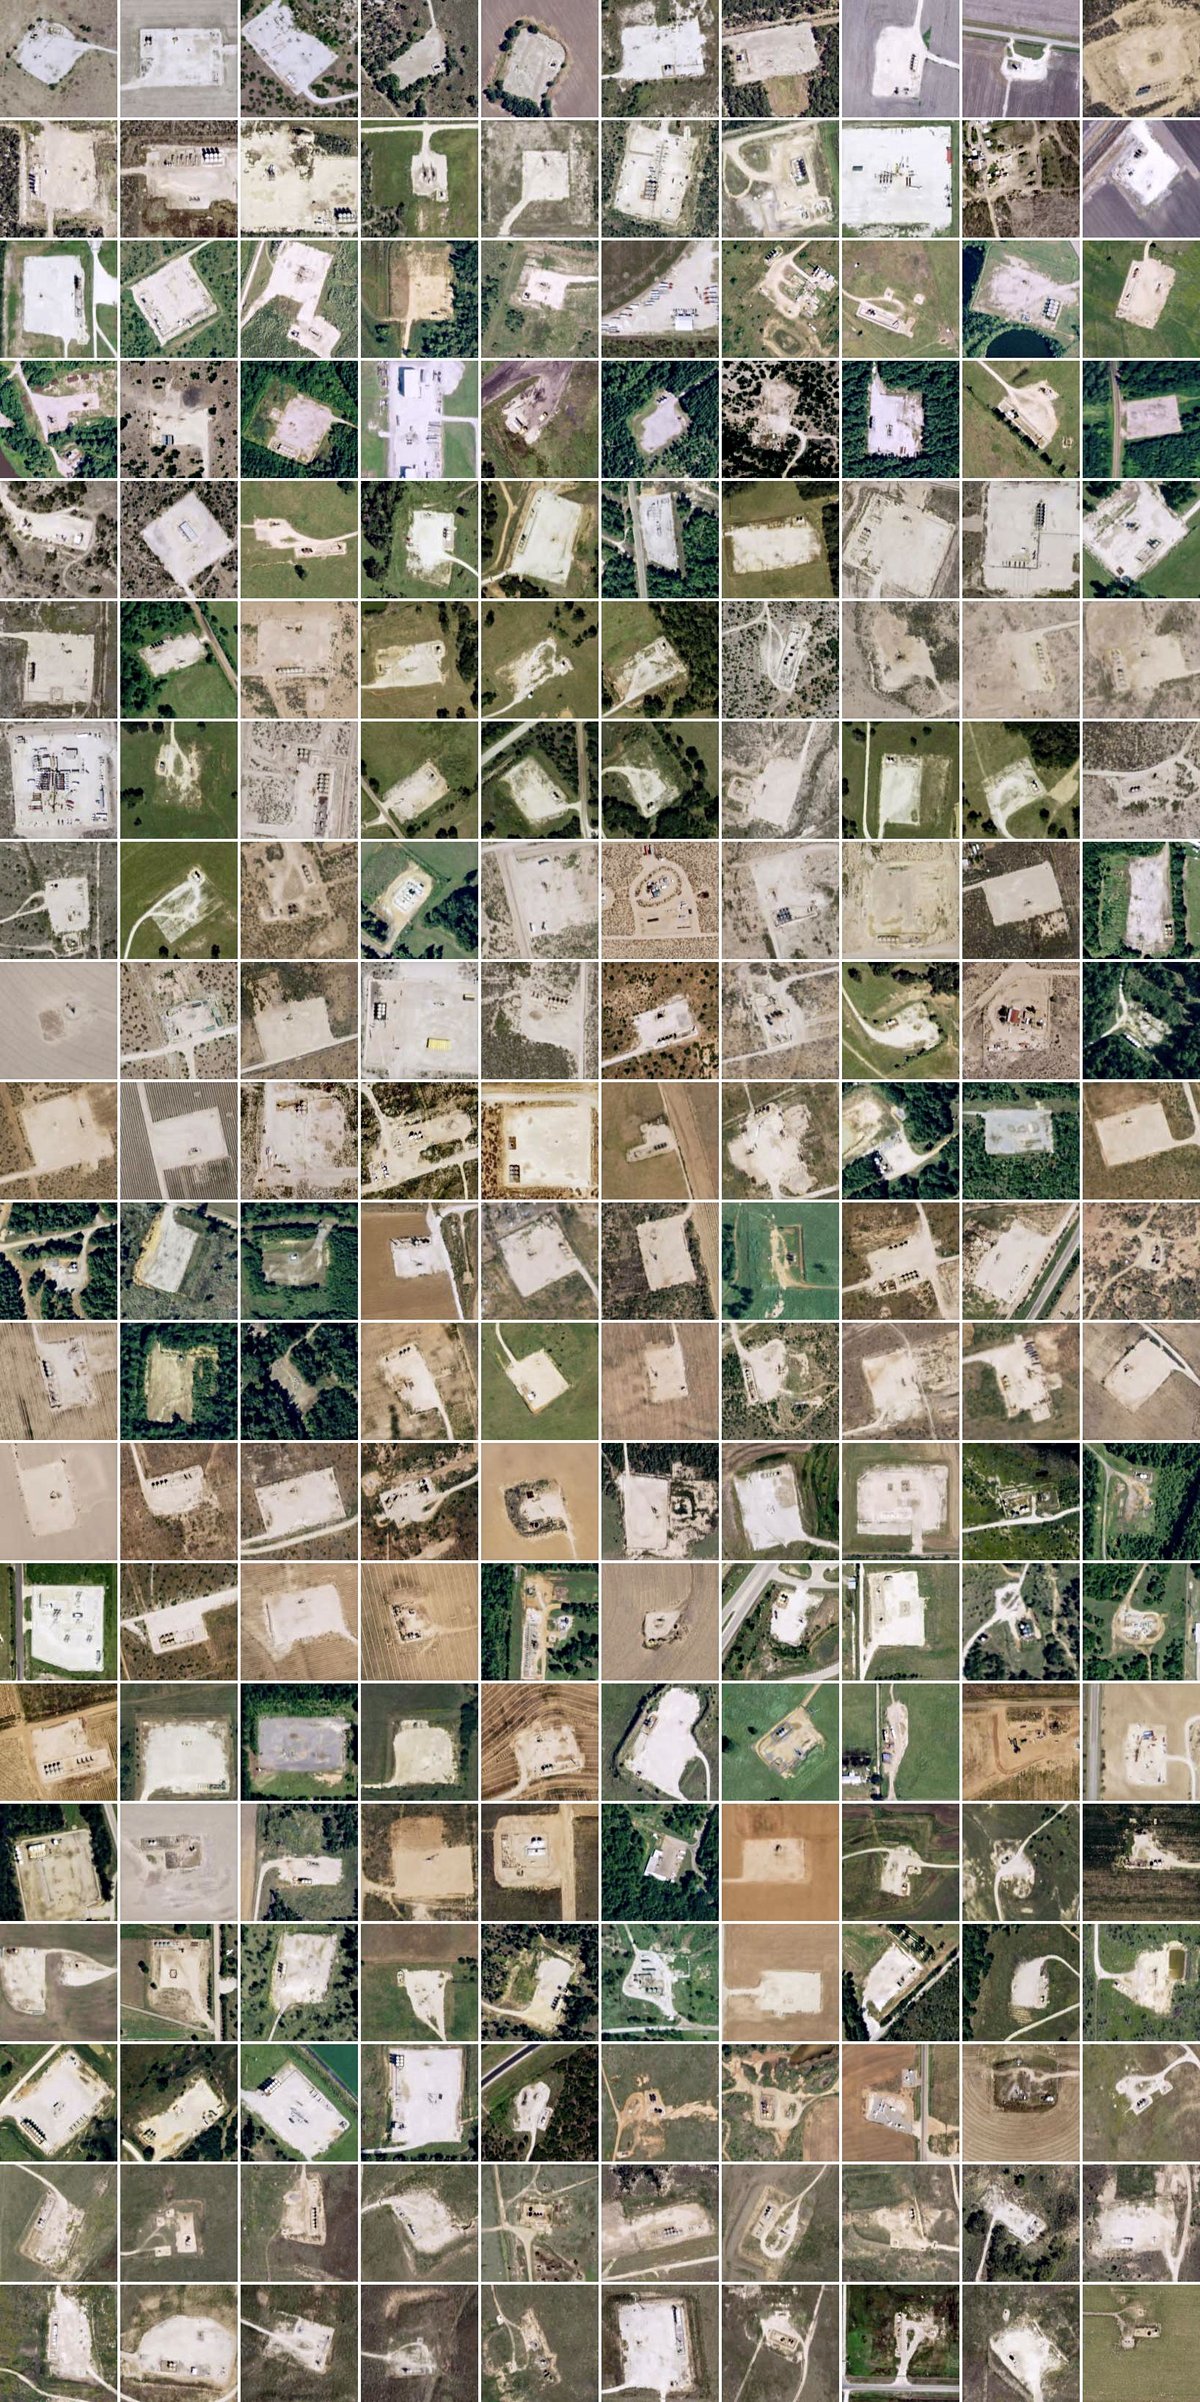
The Permian Basin, which is located largely in West Texas and may become the world’s most prolific oil field, rightfully gets a lot of attention when it comes to Texas oil and gas production. To some, the Permian might look like an industrial and fiery wasteland, with nothing in sight but oil and gas well pads (and infrastructure to support their operations) for hundreds of miles. But to landowners who are reaping rewards from this region, the infrastructure indicates booming industry.
One big reason why Texas, and the Permian Basin in particular, has become an oil and gas juggernaut on the world stage is because of hydraulic fracturing, commonly called fracking.
The life cycle of a frack site is quite rapid once construction begins. Crews arrive on site bringing water tanks, sand kings, drilling equipment, fracturing pumps and more. Drilling (first vertically, then usually horizontally) and hydraulic fracturing (when fracking fluid is injected into the ground) occur quickly, usually within weeks. Once the well has been stimulated, hydrochloric acid is pumped into the formations to facilitate the flow of fluid and gas. Finally, gas processing units and pipelines are installed, and the well pad comes online and begins operating. Eventually, the pipelines run empty, the well pad is abandoned, but the inoperative site remains a part of the vast, visible, and ever-changing Texan energyscape.
We can monitor many stages of the life cycle of oil and gas well pads by fusing information from optical information (construction, storage tanks, equipment), infrared (flaring), and radar data (metallic objects). Each data source can provide a unique look at a well pad, but when merged together, they reveal a more nuanced view of the well pad’s life span and production.
Descartes Labs is monitoring all of the energy production in Texas (and around the world). For the moment, we see that oil and gas still reigns supreme in the state (just have a look below!), but wind and solar are coming up fast. It will be interesting to monitor how the landscapes of traditional oil and gas towns evolve, as McCamey has, as wind and solar continue their rapid growth in the region.