Article category: Science & Technology, Company News
Apply for Our Impact Science Program and Get Your Hands on...
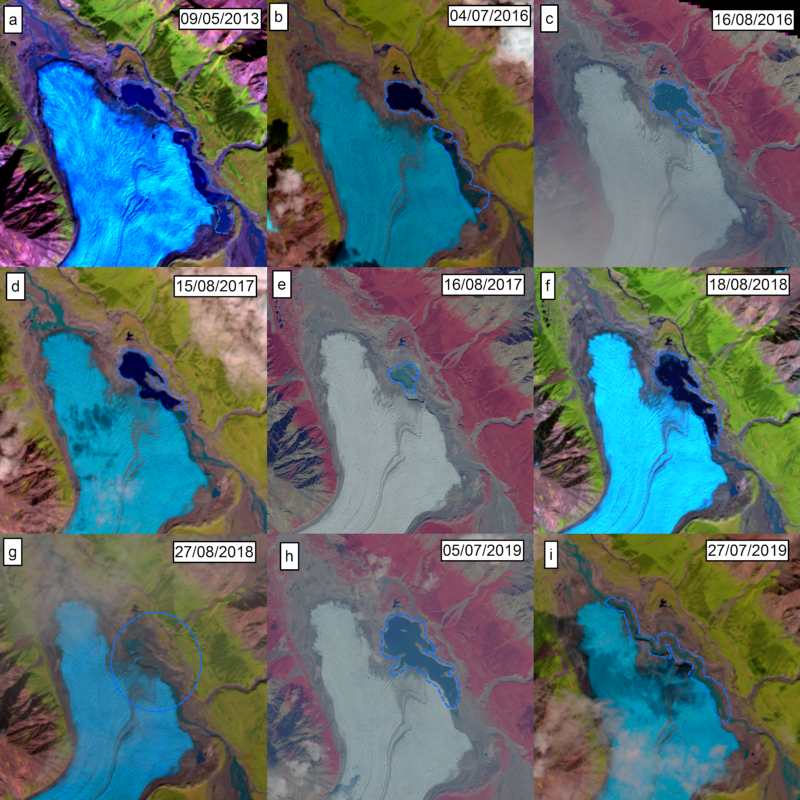
The Donjek Glacier has temporarily dammed the Donjek River multiple times during the last few...
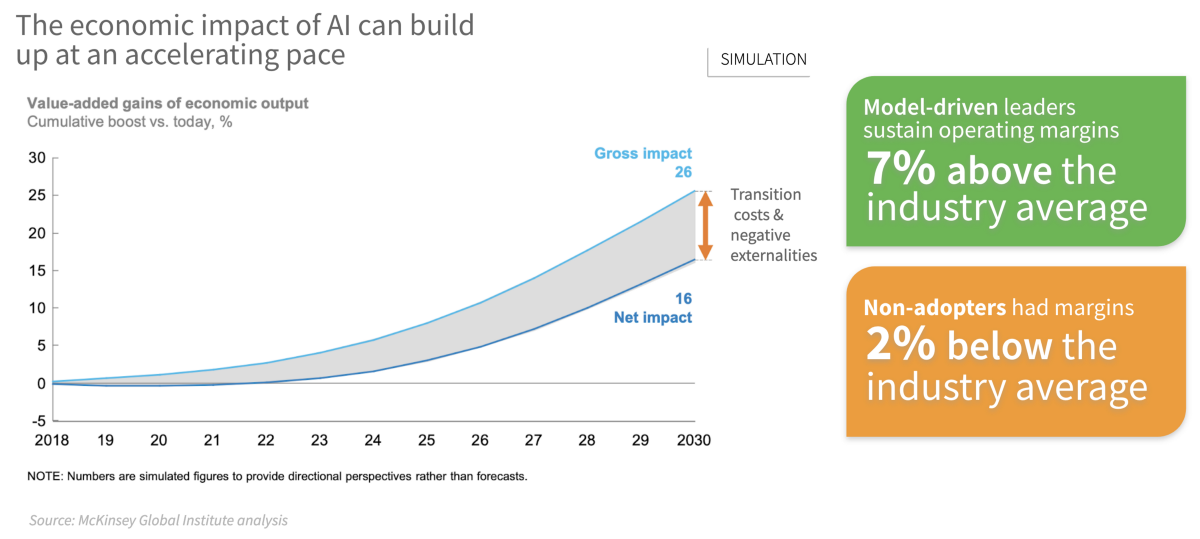
From a technological standpoint, the adoption of artificial intelligence (AI) into organizations’ operations will likely define this new decade. Many of the world’s leading companies have already started achieving substantial breakthroughs in efficiency, productivity, and sustainability by incorporating AI into their decision-making processes. Moreover, the McKinsey Global Institute projects a growing divide in performance over the next decade between companies that adopt AI into their workflows and those that do not. Thus, businesses today are facing the urgency of determining how to assimilate these technologies into their operations.
Given the inherent spatial nature of supply chains and the increasing risks from extreme weather events, geospatial data have become a key source of information for generating actionable insights and predictions. But the more complex nature of geospatial data means businesses encounter new sets of challenges as they try to deploy geospatial AI models at scale.
At Descartes Labs, our applied scientists have spent the past half-decade using our proprietary geospatial data science platform to solve some of the world’s most challenging problems. And now, as we enter this new decade, our goal is to empower organizations to harness the potential of geospatial data and AI to increase the efficiency, productivity, and sustainability of their operations.
For this reason, we will soon be making our new geospatial data science platform and tools available to organizations so that they can easily build their own AI models at scale. Get in touch to be notified about our launch in the coming weeks!
To demonstrate how quick and easy it is to extract meaningful information from geospatial data using the Descartes Labs Platform, here we use it to analyze a problem at the cornerstone of water resources management and renewable energy: water storage within a reservoir.
For this case study, we will focus on Folsom Lake, which is a reservoir in Northern California, northeast of Sacramento, that was created on the American River in 1955 with the construction of Folsom Dam. The reservoir is part of the Central Valley Project, which provides water for domestic consumption and irrigation to California’s Sacramento and San Joaquin Valleys, which are some of the world’s most productive agricultural areas. The main function of Folsom Dam is flood control, but it has 198.72 MW of installed capacity for hydropower generation, and it is also used to help preserve fisheries along the American River, manage salt-water intrusion in the Sacramento-San Joaquin Delta, and support tourism and recreational activities. Thus, it is an important component of California’s highly-managed hydrologic system.
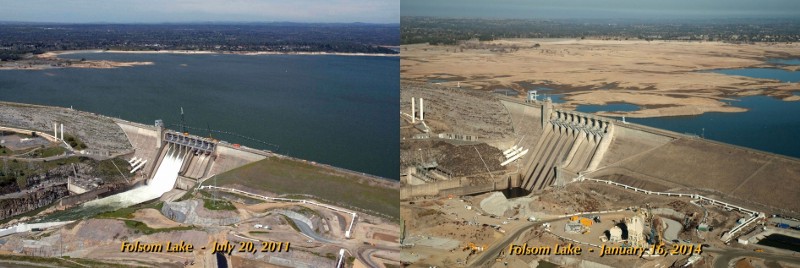
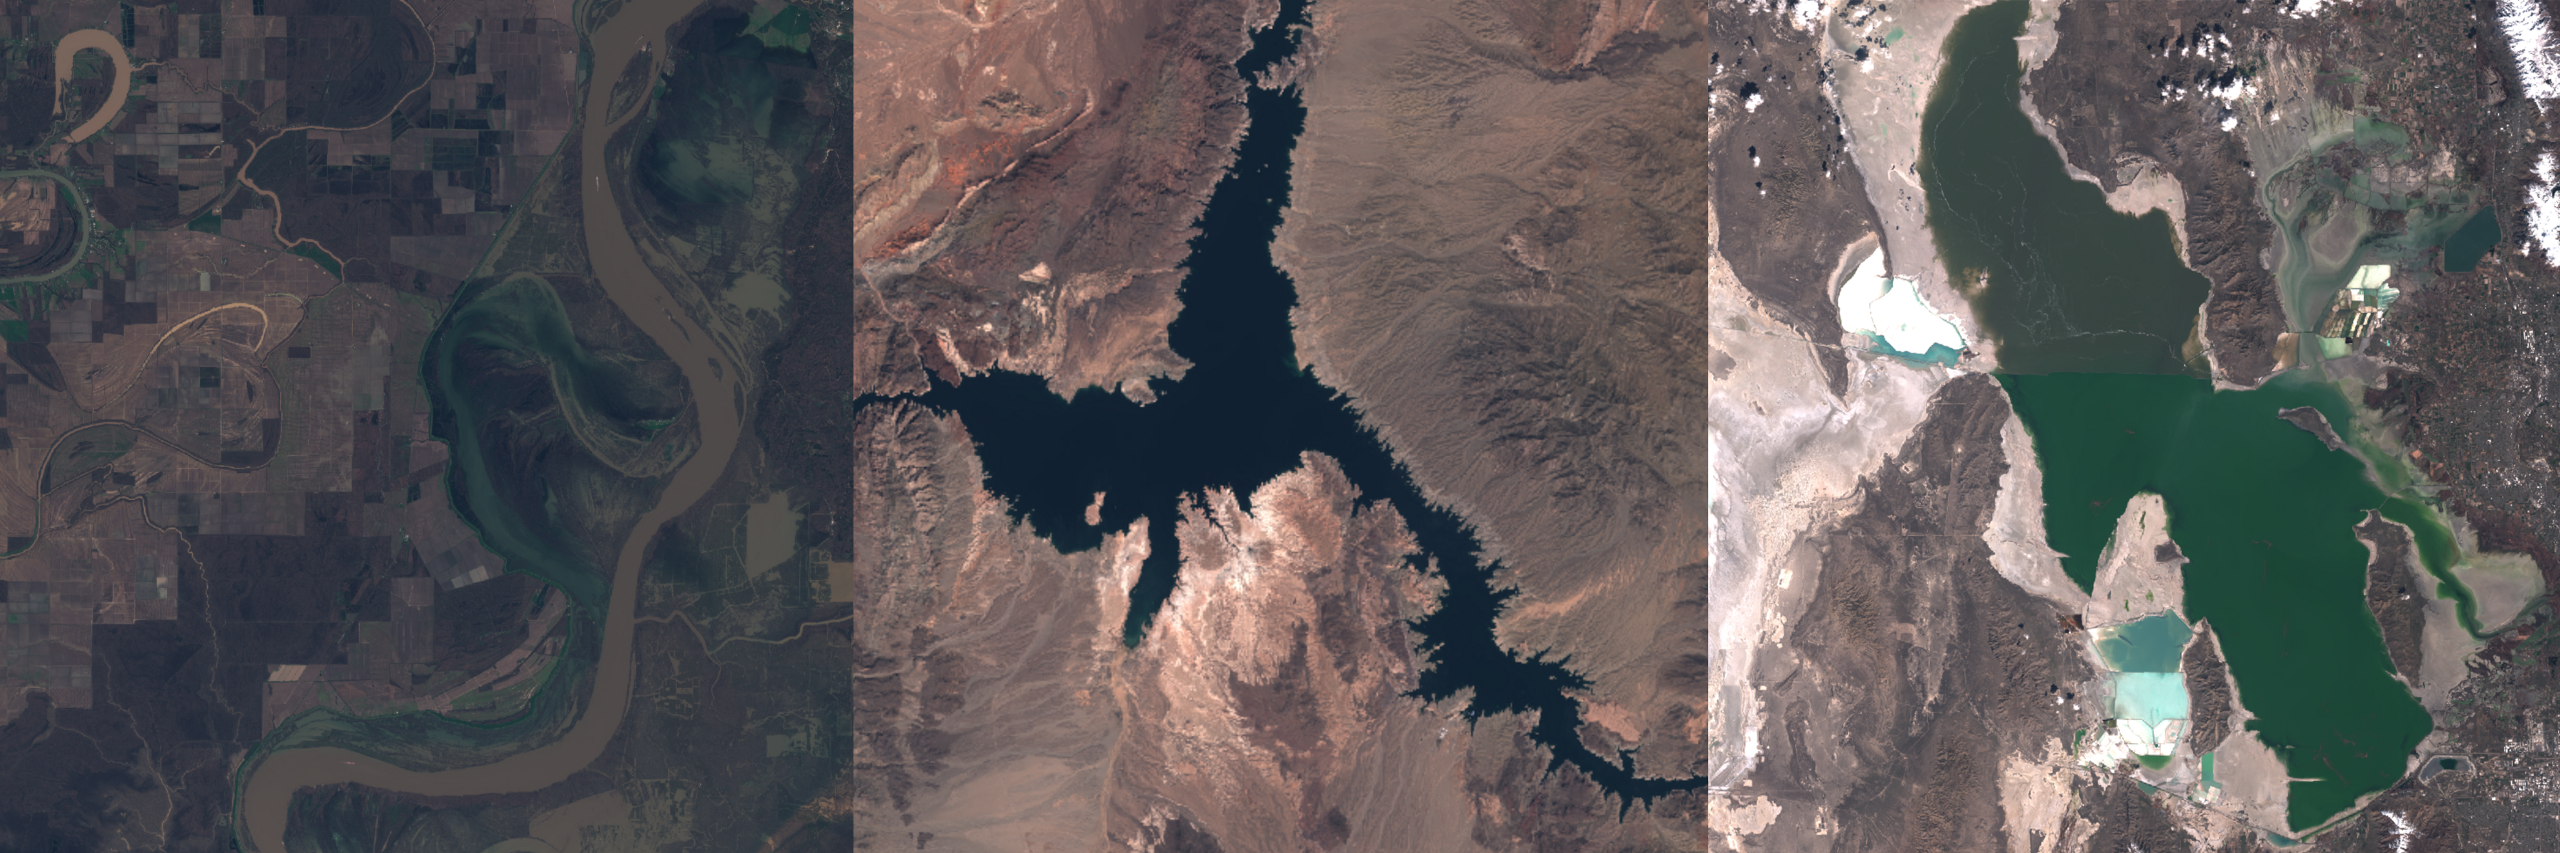
The severe drought that struck California between 2012 and 2016 caused a severe drop in water levels in reservoirs across California. NASA estimates that on January 16th, 2014 (right image), Folsom Lake was at 17% of its capacity and 35% of the historical average, compared to 97% of total capacity and 130% of its historical average on July 20th, 2011 (left image).
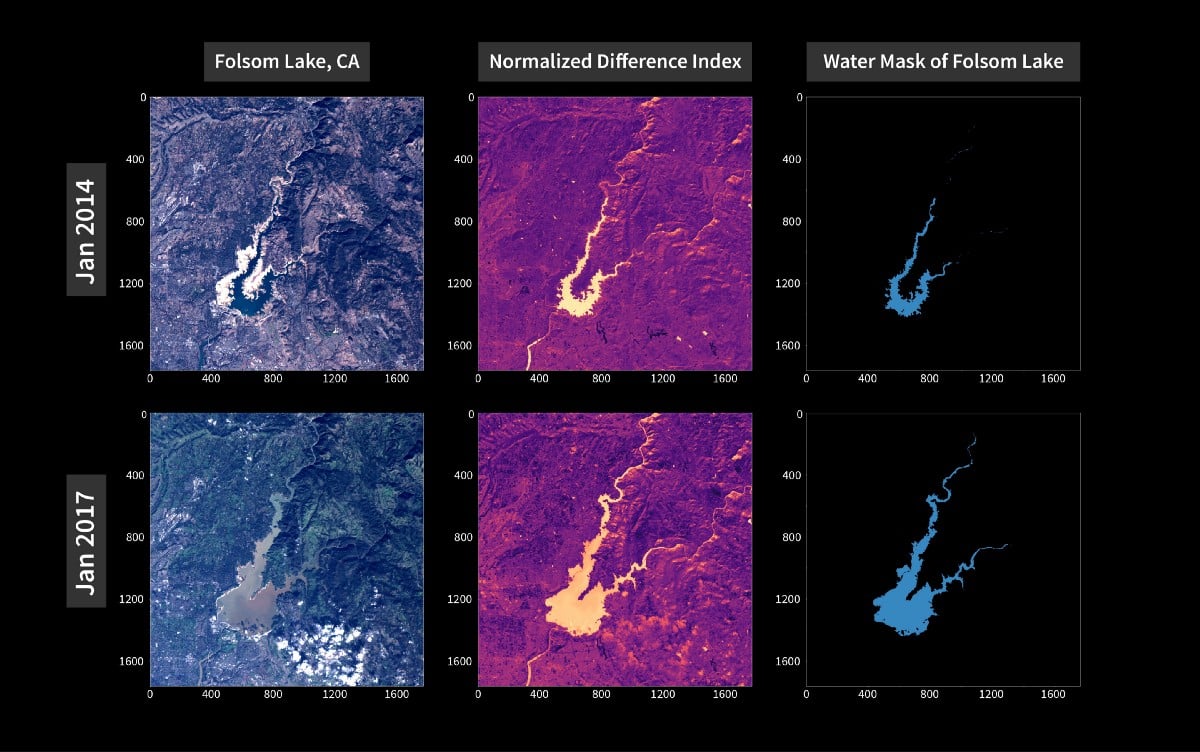
For this case study, we use images from NASA’s satellite Landsat 8 available on the Descartes Labs Platform, to monitor the extent of Folsom Lake between April 2013 to November 2019. Together with monthly water storage data from California’s Department of Water Resources and hydropower generation data from the U.S. Energy Information Agency, we build a set of statistical models that allow us to monitor the lake’s storage and forecast hydropower generation by Folsom Dam one-month ahead.
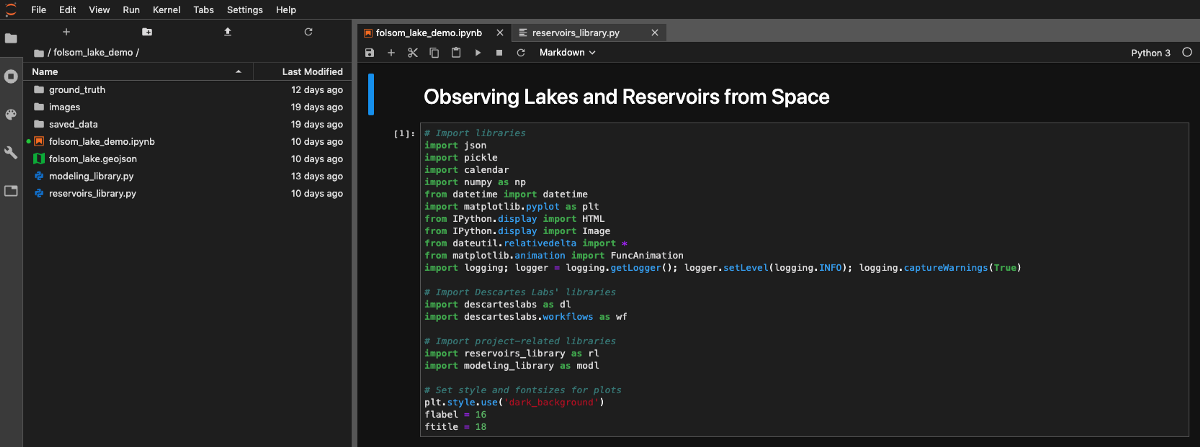
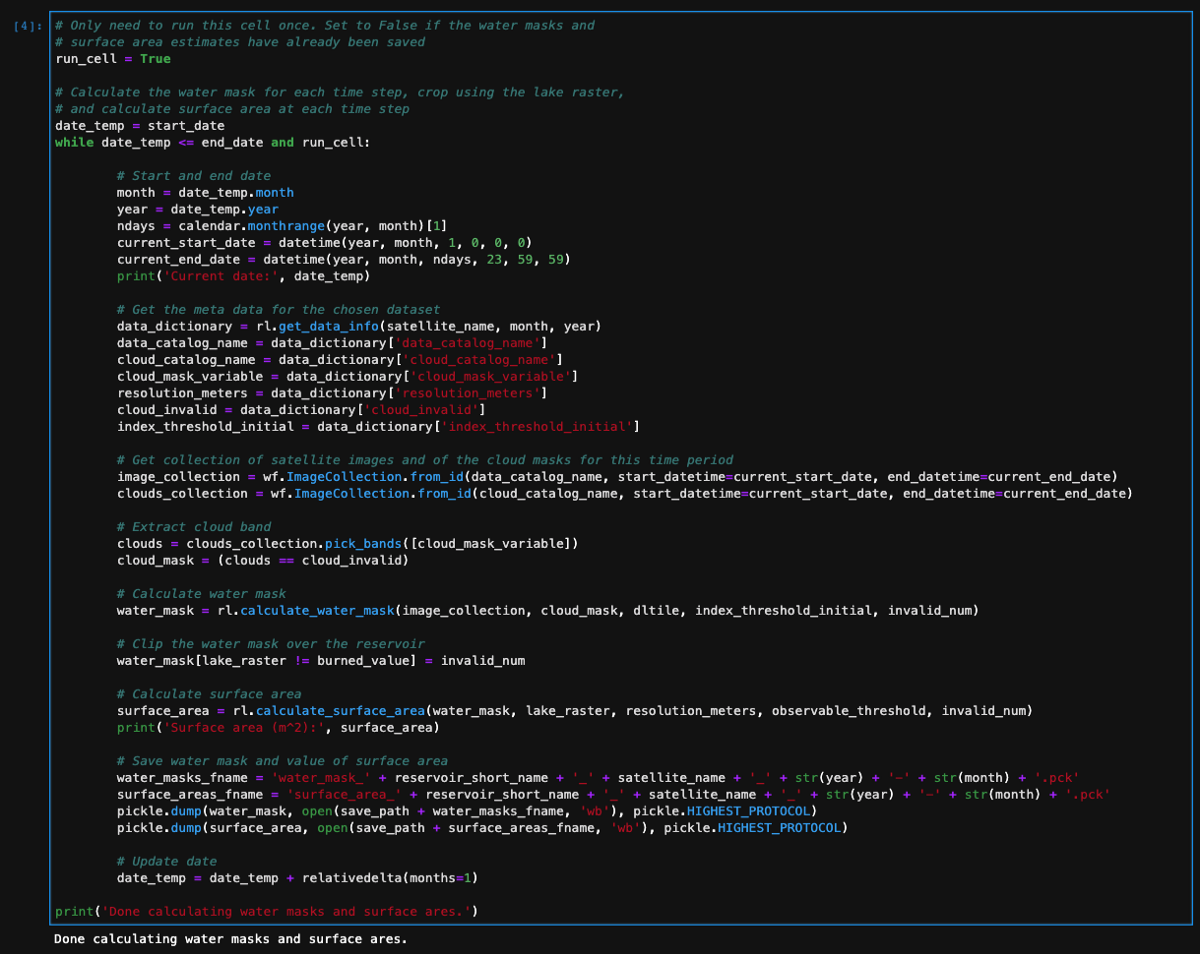
Within the Descartes Labs Platform, it is easy to develop this application using Python inside a Jupyter notebook. We can load each Landsat 8 image available, use Descartes Labs’ pre-calculated cloud masks, identify the water pixels in a monthly image composite over the lake, estimate the lake’s surface area through time, and use these estimates to train our statistical models of water storage and hydropower generation.
The animation below shows the results of our analysis. On the left, one can see the evolving extent of Folsom Lake between April 2013 and November 2019. The right-hand side of the animation shows three time series charts. The top corresponds to the time series of the lake’s surface area calculated from the Landsat 8 images. The middle shows the time series of the observed water storage together with the estimates of water storage produced by our statistical model during both the training and testing time periods. Lastly, the bottom chart shows the time series of hydropower generation by Folsom Dam together with the one-month-ahead prediction from our statistical model (also divided into training and testing periods).
Our statistical models based only on the lake’s surface area are remarkably accurate, particularly for water storage. Predicting hydropower generation is admittedly a harder problem because there are a number of factors that operators consider when deciding whether to release water through the turbines, such as flooding concerns, the prices of natural gas and electricity, and irrigation requirements. Yet, our model for hydropower accurately captures periods of low generation, which is to be expected since there is a strict physical constraint (i.e. lack of water) for generating hydropower during the dry season and drought. These predictions of decreased hydropower generation may already provide useful information for stakeholders in the Energy and Environment sector since decreases in hydropower generation are linked to increased emissions from the power sector as well as higher electricity prices.
Our hydropower model missed the increase in generation during the winter of 2017. This increase was due to that year’s record-breaking wet season over California. During this period, Folsom Dam was releasing tens of thousands of cubic feet of water per second as even larger amounts of water were simultaneously flowing into the lake. Thus, to improve our hydropower model in the future, we can include additional predictors such as weather forecasts, together with the prices of natural gas and electricity.
We can easily measure the surface areas of any other reservoir in the world by simply providing its location and bounding polygon. If ground truth data on storage and hydropower generation is also available for the reservoir in question, we can also build statistical models similar to those for Folsom Lake (each reservoir requires its own set of models). Moreover, if the reservoir of interest is located in a particularly cloudy region, we can use Synthetic Aperture Radar data from ESA’s Sentinel-1 satellite (also available on our Platform), which can identify water pixels regardless of cloud cover.
As shown through this example, the Descartes Labs Platform gives its users the power to build near-real-time monitoring and forecasting capabilities, and place them within a historical context. Our platform helps businesses leverage the synergies that result from combining multiple datasets, including their own, and deploying their AI models at scale.
Starting in a couple of weeks, the only limit to the number of insights that your business will derive from geospatial data will be the rate at which your data science team can think of applications to build on the Descartes Labs Platform.
What will your team create next?
Get in touch to discuss how the Descartes Labs Platform can accelerate productivity across your enterprise. Sign up to be notified about our commercial launch at the end of January.
Julio E. Herrera Estrada is an Applied Scientist at Descartes Labs. He has a PhD in Civil and Environmental Engineering from Princeton University, and he specializes in climate risks, water resources, and sustainability.