Article category: Consumer Goods
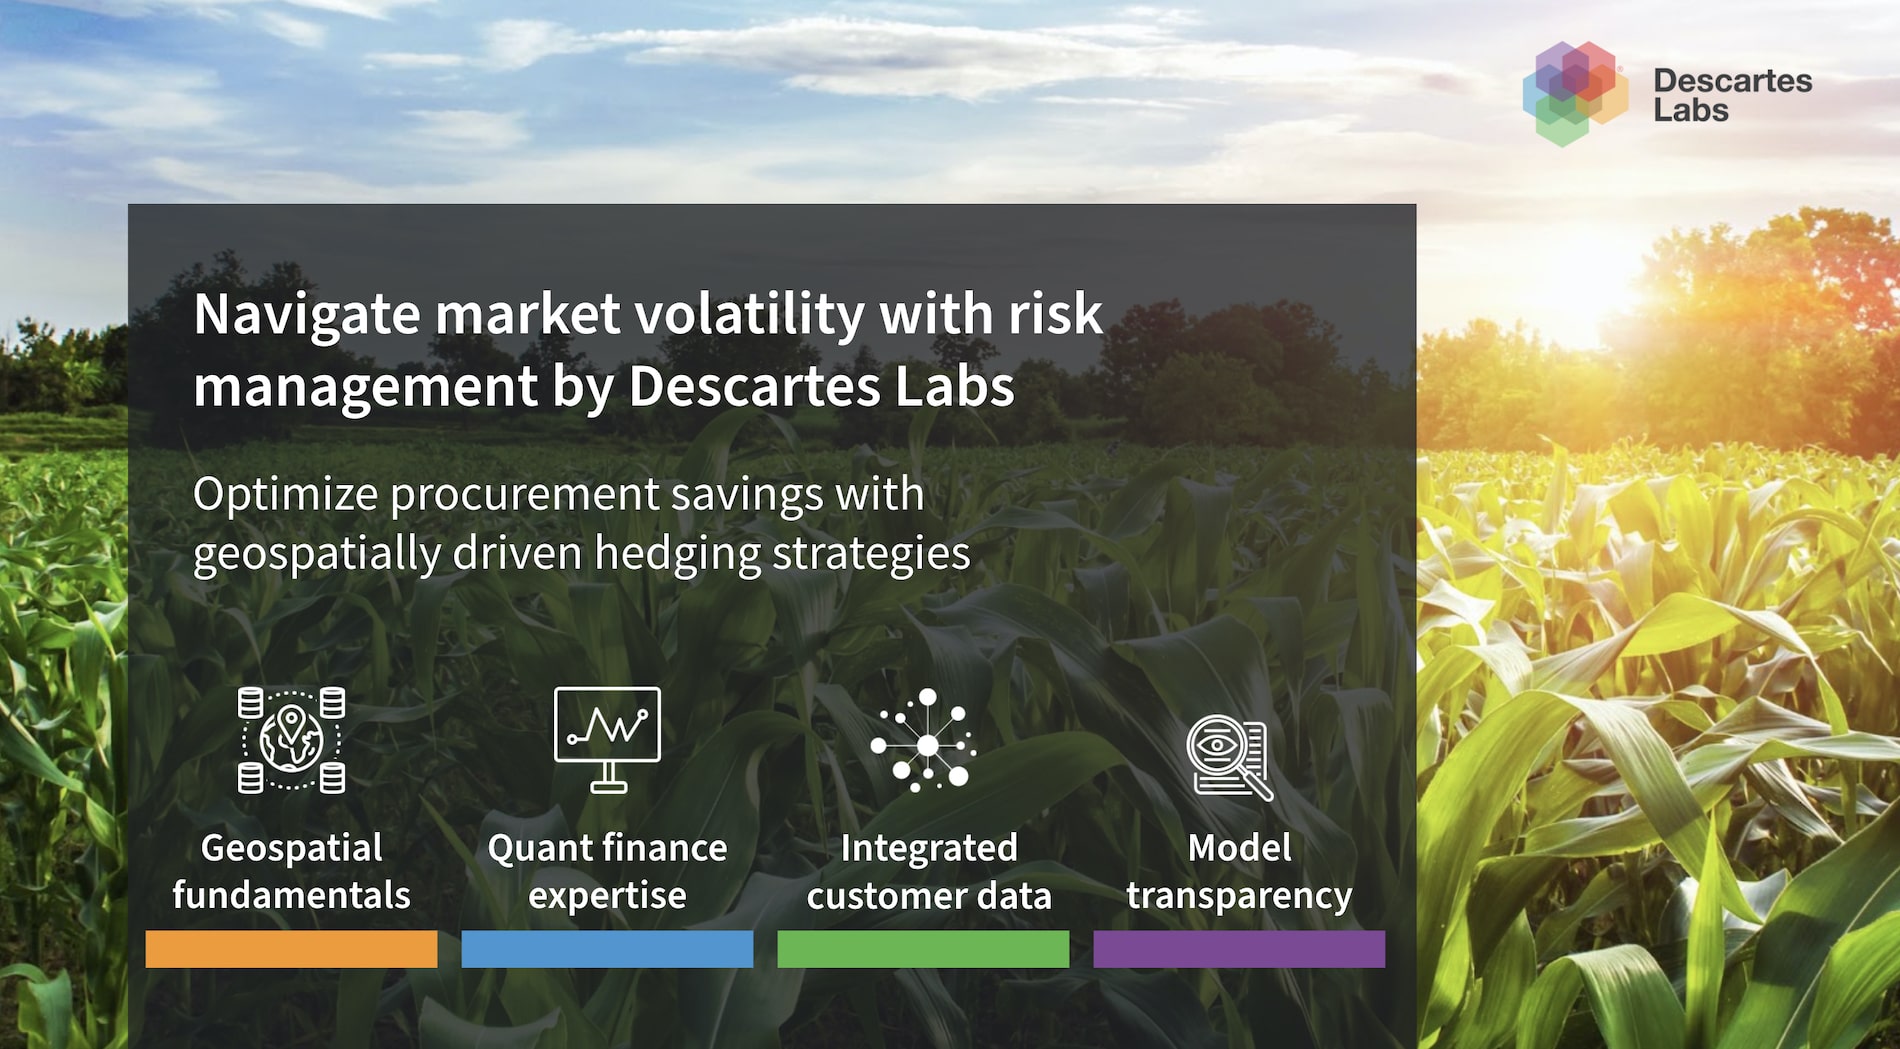
Announcing Packaged Analytics for Four New Commodities
Actionable price forecasts, market insights, and purchasing recommendations for London Cocoa,...

As this Halloween approaches, it’s not just ghouls and goblins that spook cocoa traders; the record high cocoa futures prices can be equally chilling. Cocoa traders need reliable forecasts and hedging strategies. With advanced geospatial data analysis and ability to fuse multiple data sources (weather, spectral signals of crop health, AIS signals from ship transceivers, grindings, financial flows, option data, futures price behavior, NLP analysis of financial news and social media, etc), Descartes Labs builds an ML/AI based digital twin of the globe’s cocoa supply chain to produce a highly robust series of cocoa futures price forecasts at multiple horizons. To prove their worth, Descartes Labs deploys them in procurement recommendation strategies that generate savings between 5 and 9% over benchmark strategies.
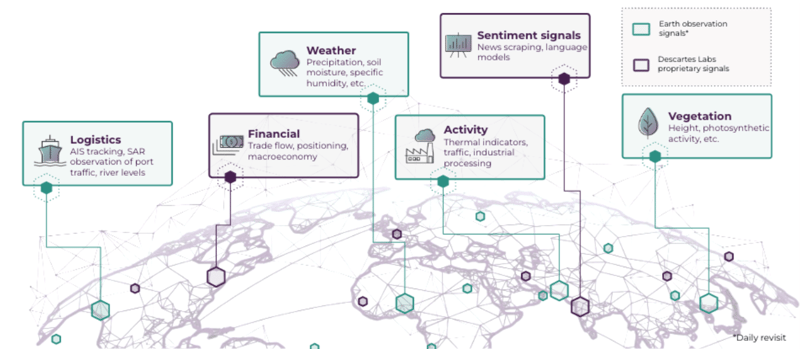
Cocoa, a tropical crop, is heavily influenced by geographic factors. The precise location and weather conditions in cocoa-producing regions can significantly impact cocoa bean production, and subsequently, cocoa future prices. Leveraging our fusion of data can help traders and procurement officers stay ahead of the curve. One key element of our geospatial strategy for cocoa is weather data, which enables our forecasts to anticipate potential supply shocks during unfavorable weather conditions, like droughts, excessive rainfall or the Harmattan winds. For instance, we can forecast higher than normal rainfall at key times in the crop cycle that can trigger outbreaks for black pod disease, severely curtailing supply. Satellite imagery is another vital component of our geospatial approach. By monitoring cocoa plantations from space, we can gain insights into crop health and growth. Are the cocoa trees flourishing or are they suffering from pest-borne disease like the swollen shoot virus that is plaguing crops in Ivory Coast? We combine this geospatial analysis with financial data (positioning, mean-reversion, or even financial costs of inputs to production like fertilizer). Finally, we layer text-analysis signals.
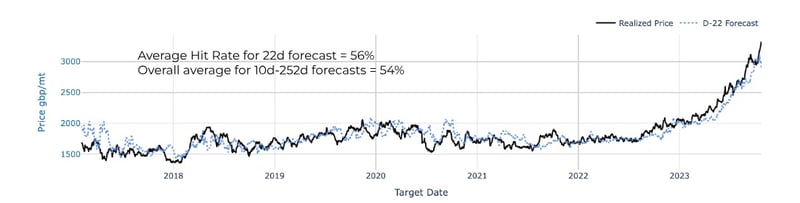
A broad net for data sources and careful distillation of signal from noise allows us to generate highly accurate forecasts. The plot below depicts our 22 day forecasts (Figure 2). The average hit rate from 2018 to date is 56%. Across all our forecast horizons (ranging from 10d-252d), the average hit rate from 2018 to date is 54%.
To monetize these superior forecasts, let’s turn to hedging strategies to ensure savings in your procurement strategy. An example use-case would be a client who needs to ensure a quota of delivery to be available for their October 2023 manufacturing process. They normally would hedge this by locking in an equal amount of quota using the 2023 Z (December) contract each day during June and July 2023. That constitutes the benchmark strategy.
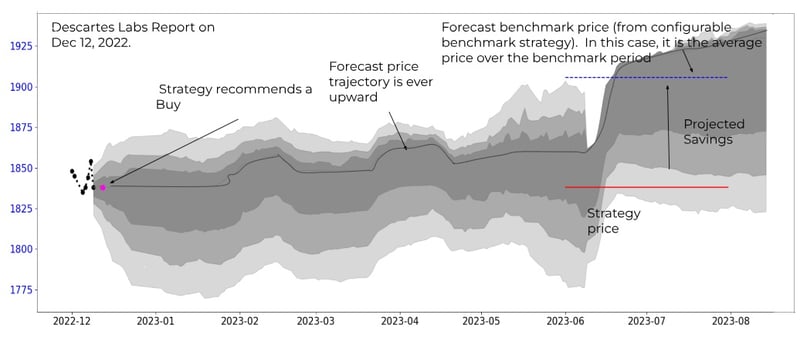
The first plot below (Figure 3) shows the Descartes Labs strategy report as of last December 12, 2022. The time frame represented is the full purchasing period. The black dots represent the realized prices thus far. The gray line represents the Descartes Labs forecast price trajectory with scenario-based confidence bands. On that day, the trajectory was shooting ever upward so the strategy, recognizing a minimum, recommended the client to lock in purchases on the next day. This is indicated by the red dot. The projected price for the benchmark strategy is the average of the prices over the benchmarking period. For ease of comparison, a red line at the level of the strategy’s lock-in price is drawn over that same period so the projected savings is more easily identifiable.
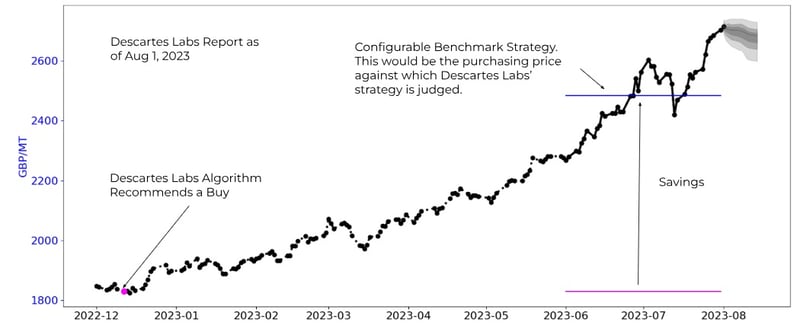
Fast-forward to a more recent date in August 2023 near the end of the designated purchasing period (Figure 4). Indeed the Dec 2022 lock-in was near the minimum price for the period. The prices for the benchmark period have now been realized and their average is represented by the blue line. Compare this with the Descartes Labs Strategy buy (the magenta dot). The distance between the magenta line and the blue line represent the savings over the benchmark of nearly 20%.
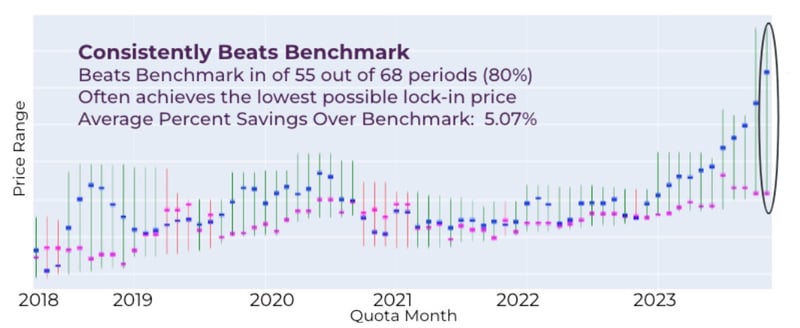
To see whether the strategy has been consistent in its ability to beat the benchmark, we provide each day a track record of performance (Figure 5). Across the x axis are the quota months for each manufacturing period. The October 2023 purchasing month represented above is circled at the right. The length of the bar represents the range of prices that materialized during the purchasing period. The magenta hash represents the strategy’s achieved price, while the blue hash represents the benchmark price. When the strategy buys below the benchmark, the bar is turned green. Out of 68 periods of live action, the strategy has delivered savings over benchmark in 55 periods (80% of the time). On average the magnitude of the savings has been 5.07%. Notice also that the pink hash usually lies near the bottom of the price range, indicating that the strategy is able to lock in at or near the period low. This prediction advantage is particularly magnified in the current upward-trending price environment precisely when it is of most value to procurement officers.
The record run-up in cocoa prices (the highest since cocoa futures started trading in London in 1920) have resulted from a multitude of factors from disappointing harvests in Ivory Coast and Ghana because of negative weather impact and disease, more robust than expected grind numbers, declining inventories of high-quality cocoa at exchanges warehouses, and the futures-market positioning of the different players. Descartes Labs’ expertise in extracting signals from a host of different sources well before they are revealed in price, makes our price forecasts more timely, more accurate and unique and allows procurement managers to lock in substantial savings.
Learn more about our price forecasting models and procurement strategies, which cover a wide range of commodities around the globe.