Article category: Company News
Takeaways from Spinnaker Summit 2018
Here are Descartes Labs' key takeaways from Spinnaker Summit 2018.

The Descartes Labs Platform runs on Kubernetes and scales from hundreds to tens of thousands of cores in response to customer traffic.
Much of this load comes from our Tasks service, which allows users to scale out analytics models with high throughput access to petabytes of geospatial data. The bulk of the heavy lifting behind the retrieval, transformation, and delivery of this data is handled by our Raster service.
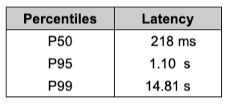
Raster can be called directly from our Python client or via RESTful API and response times can vary significantly depending on the nature of the request.
Our original approach to scaling Raster used a standard horizontal pod autoscaler (HPA) that tracked CPU utilization per pod. Unfortunately, variation in compute characteristics (requests could be I/O- or CPU-bound) made CPU utilization a poor indicator, and we needed a low threshold to stay ahead of the load.
Variation in both the nature and duration of requests meant that scaling based on request rate was also not ideal.

We have been using Istio for a long time and took note of Istio metrics-based autoscaling, but these higher level metrics (i.e., labeled request counts, duration, rate) were not an obvious fit for our service.
Fortunately for us, Envoy, the sidecar proxy used by Isti, allows us to directly measure current saturation of our Raster service. From the Envoy docs:
upstream_rq_active — Gauge — Total active requests
By summing the upstream_rq_active across all Raster pods we get an effective measure of how many requests are currently being handled by our service.
To allow Kubernetes to scale on this metric we installed the Zalando kube-metric-adapter as packaged by Stefan Prodan. We could technically configure the metric adapter to scrape this metric directly from Envoy using the JSON stats endpoint, but it made more sense to let our existing Prometheus infrastructure handle scraping and aggregation.
Update: After upgrading to Istio 1.1.x we found that the specific Envoy metric we leverage is no longer exposed by default. To configure Envoy to provide the metric you must now add the following to the pod template of the deployment you are scaling:
template:
    metadata:
      annotations:
        sidecar.istio.io/statsInclusionPrefixes:
cluster.inbound,cluster_manager,listener_manager,http_mixer_filter,t
cp_mixer_filter,server,cluster.xds-grpc
In Prometheus this metric is surfaced as:
envoy_cluster_upstream_rq_active
(this metric is also exposed via envoy_cluster_upstream_cx_active ).
Unfortunately the Istio bundled Prometheus configuration scrapes but drops this number. To retain it you must modify or remove the following lines from the Prometheus config.
- source_labels: [ cluster_name ]
         regex: '(outbound|inbound|prometheus_stats).*'
         action: drop
With the number of active requests per pod being tracked by Prometheus we could then implement our custom HPA:
apiVersion: autoscaling/v2beta1
kind: HorizontalPodAutoscaler
metadata:
name: raster-release
namespace: raster
annotations:
metric-config.object.raster-release-rq-active.prometheus/per-replica: "true"
metric-config.object.raster-release-rq-active.prometheus/query:| sum(max_over_time(envoy_cluster_upstream_rq_active{app="raster",cluster_name="inbound|8000|http|raster-release.raster.svc.cluster.local", namespace="raster",stage="release"}[1m]))
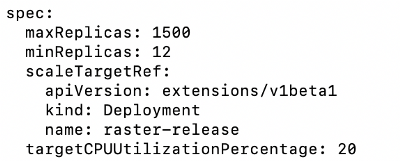
spec:
maxReplicas: 1500
minReplicas: 12
scaleTargetRef:
apiVersion: apps/v1
kind: Deployment
name: raster-release
metrics:
- type: Object
object:
metricName: raster-release-rq-active
target:
apiVersion: v1
kind: Pod
name: raster-release # needed for schema consistency
targetValue: 2
The critical part of this HPA config is the annotation block where we:
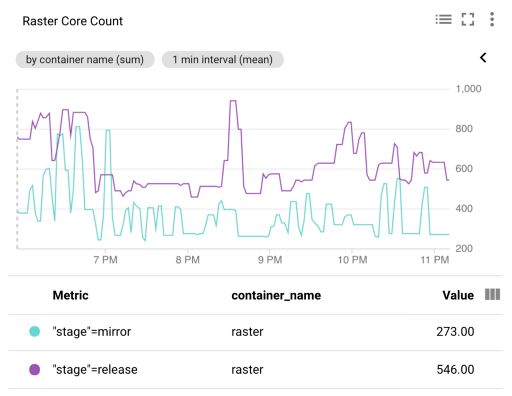
raster-release-rq-activeper-replica: “true"Raster can handle four concurrent requests per pod, so we set the targetValue to two active requests per pod.
In our small-scale testing we found that simply taking the sum of envoy_cluster_upstream_rq_active yielded accurate numbers, but when we tested with production traffic (yay for Istio traffic mirroring!) and large numbers of pods, we needed to use a window of at least one minute to get consistent numbers.
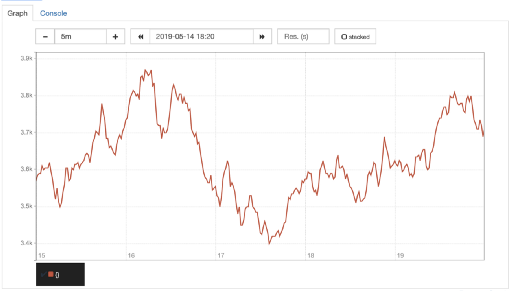
As shown below, our rq_active HPA roughly halved the requested resources. Even accounting for the delay introduced between Prometheus scraping Envoy and the metrics adapter querying Prometheus, we still get more responsive scaling than using CPU utilization, resulting in a lower 503 rate overall. We saw these trends continue once we applied our custom HPA in production.