Article category: Company News
Gary Lang Joins Descartes Labs to run Engineering
Descartes Labs teamAs Descartes Labs grows rapidly, we’re constantly adding to the executive team...
Updated with aggregated mobility data from Friday, June 5th, 2020
Review our aggregated mobility tracking methodology in our technical paper: Mobility Changes in Response to COVID-19. We are making views of this mobility data freely available at the US admin1 (state) and admin2 (county) level under a Creative Commons Attribution (CC BY 4.0) license at the following GitHub repository.
Coronavirus is having a profound impact on everyday life—canceled schools, closed restaurants, working at home, no gatherings of more than 10 people, etc.—with one commenter saying “it’s like we’re pushing the pause button on the economy.”
Despite the gloom and significant personal impacts, there’s also widespread belief we’ll get through this—the question is when?
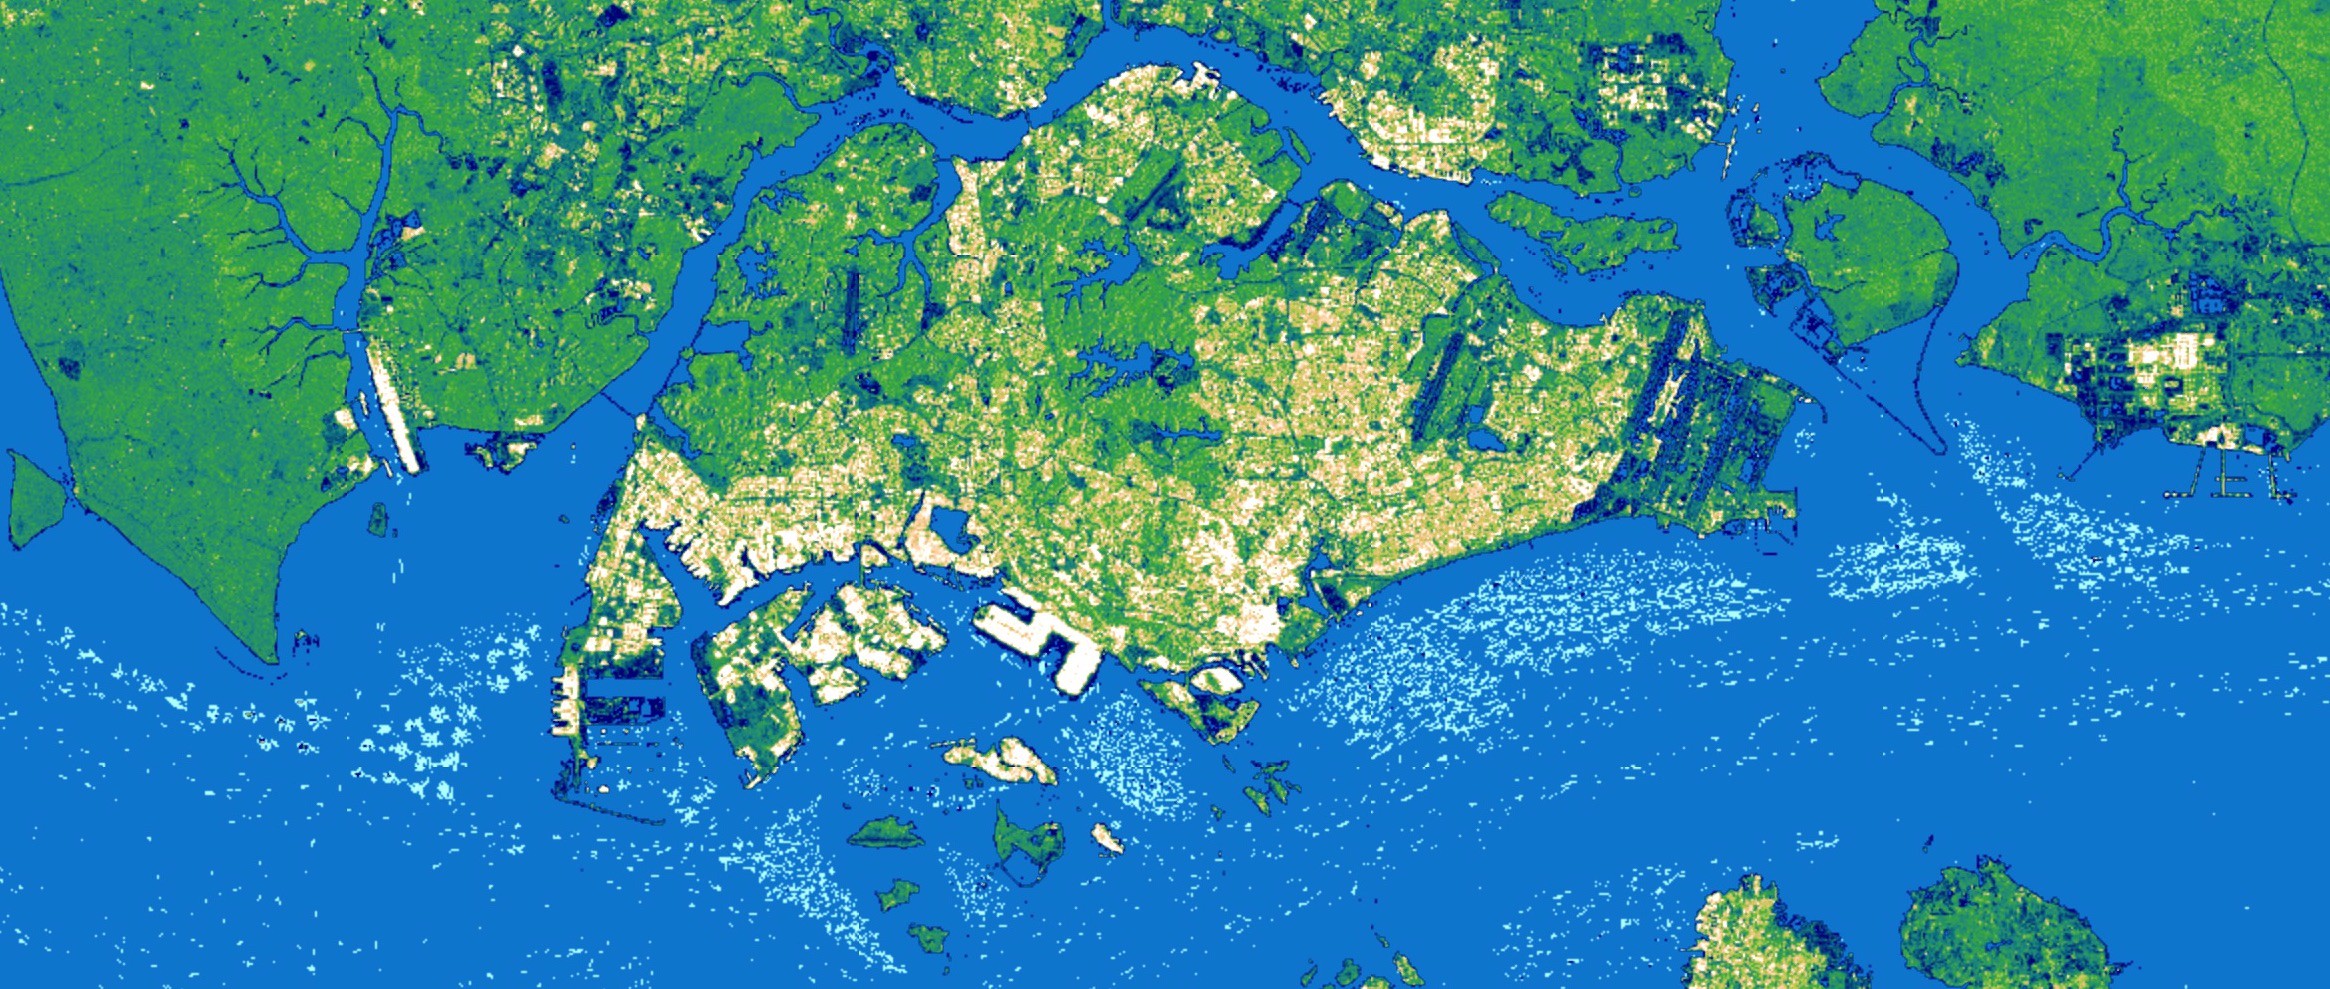
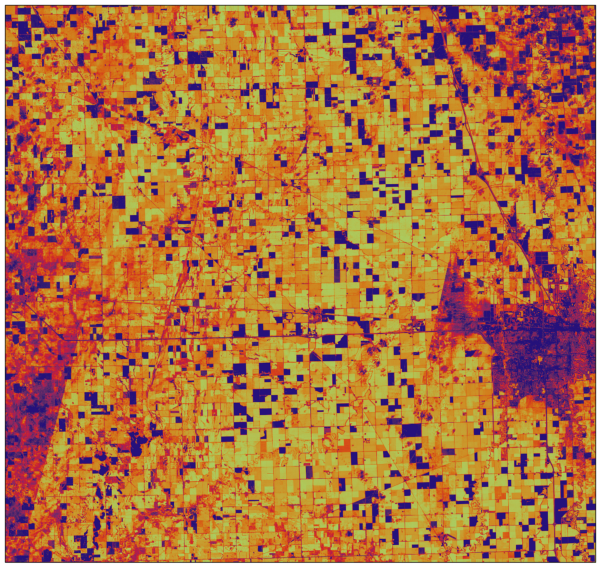
Remote sensing refers to data collected from satellites, aircraft, and distributed sensors that can provide information about the earth and help us understand human activities at a macro scale. While it is possible to understand the economic consequences of coronavirus through news reports and surveys, remote sensing provides direct observations that can be aggregated on a large scale and automatically processed for real-time insights.
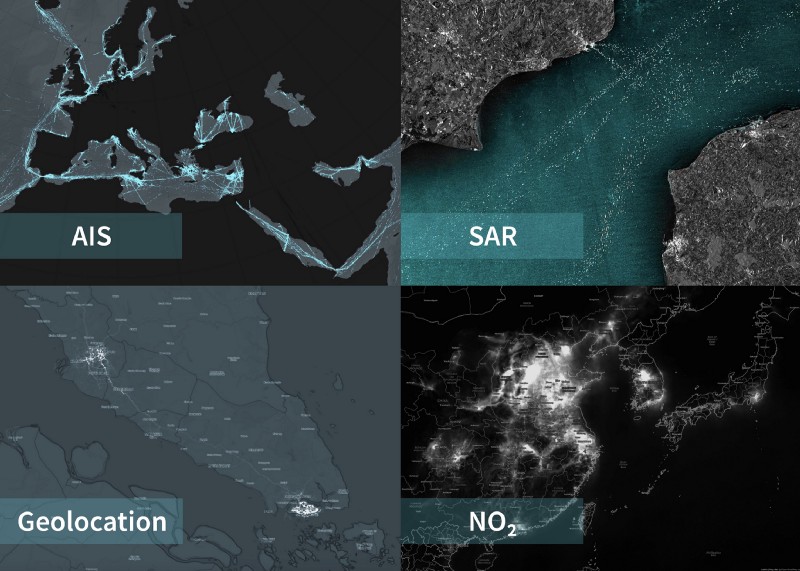
Using remote sensing at Descartes Labs, we’ve developed a set of tracking and monitoring tools that can be used by businesses to understand consumer and supply chain activities that are critically important to revenues. Here are four types of signals that our customers are already leveraging to better navigate the global crisis:
By combining multiple data sources, we can observe motions of everyday life—going to school, commuting to work, heading to the park—to see patterns comparing activity today with activity six months ago, or last week until today.
Changes in social activity are a leading indicator of economic activity. Fewer movements, less growth; more movements, more growth. By monitoring and understanding these activity patterns on a global scale, we can provide a first-hand view of stabilization moving toward eventual growth.
In the example below, we look at aggregated mobility at the country level. Our methodology looks at a collection of mobile devices reporting consistently throughout the day. We calculate the maximum distance moved in kilometers (excluding outliers) from the first reported location. Using this value, we calculate the median across all devices in the sample to generate a mobility metric for each country.
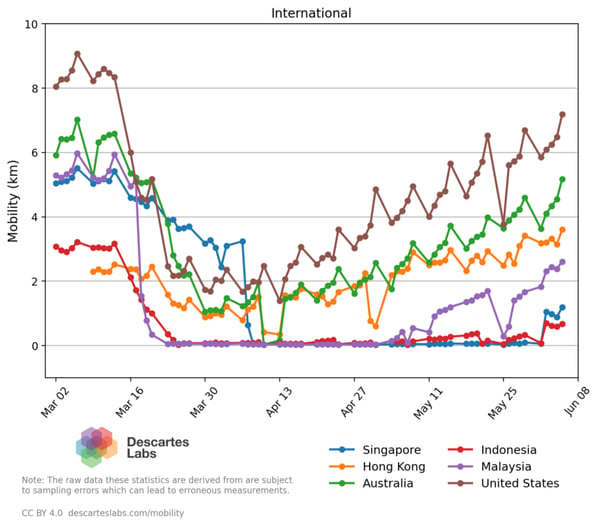
Some interesting insights immediately appear:
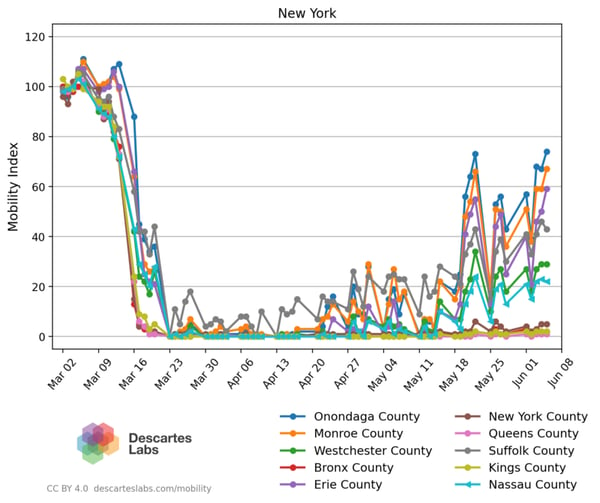
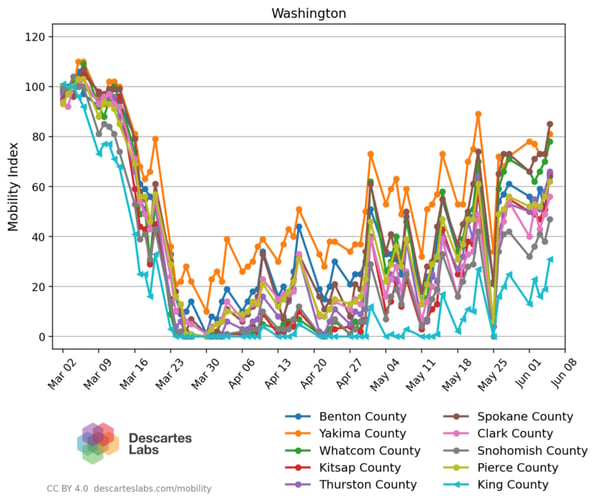
Running this same analysis over counties in New York and Washington state and converting to a “mobility index” shows major declines occurring just within the past week (100 = median weekday mobility, week of Feb 16th).
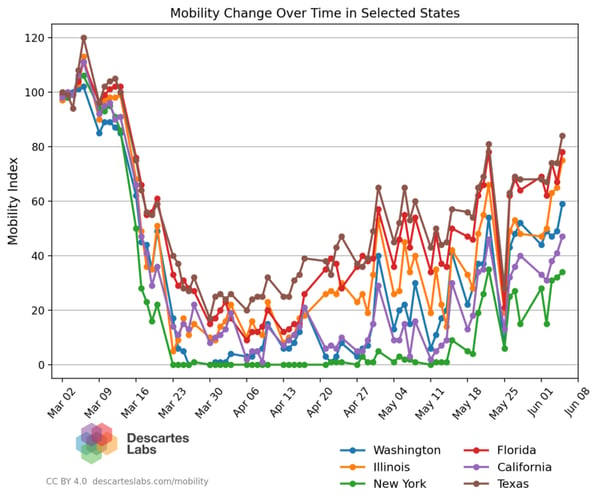
And here’s the same chart for select US states:
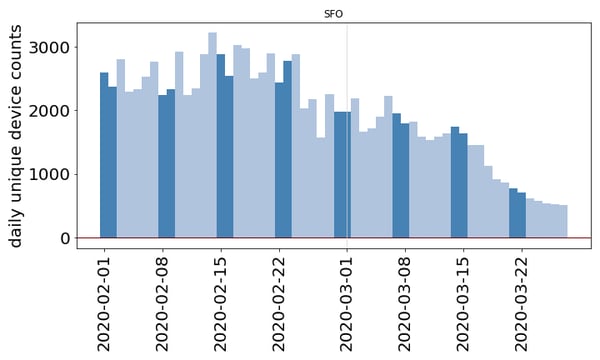
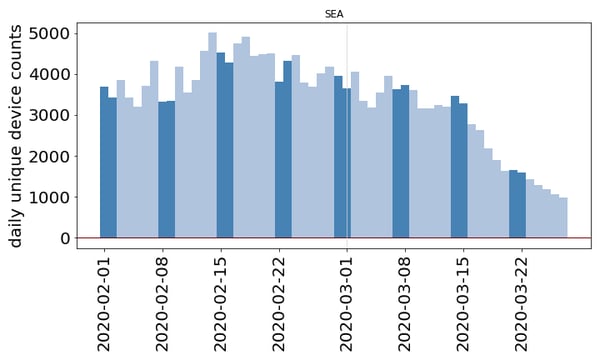
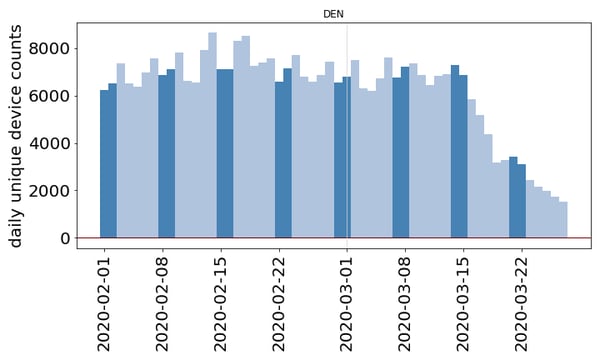
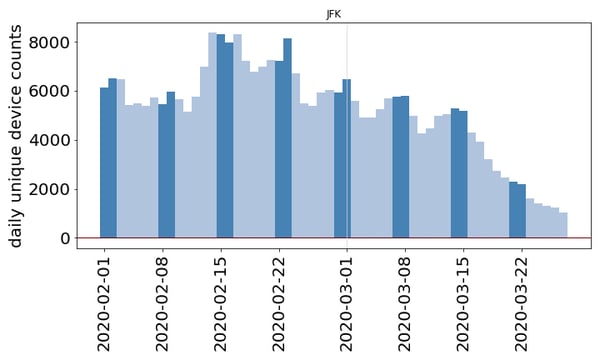
For companies that want to track very specific kinds of activities, we also have the capability to observe aggregated activity on a per-location basis—airports, malls, casinos, restaurants, and industrial parks—to better understand the relative differences for very targeted locations across unique geographies and timelines.
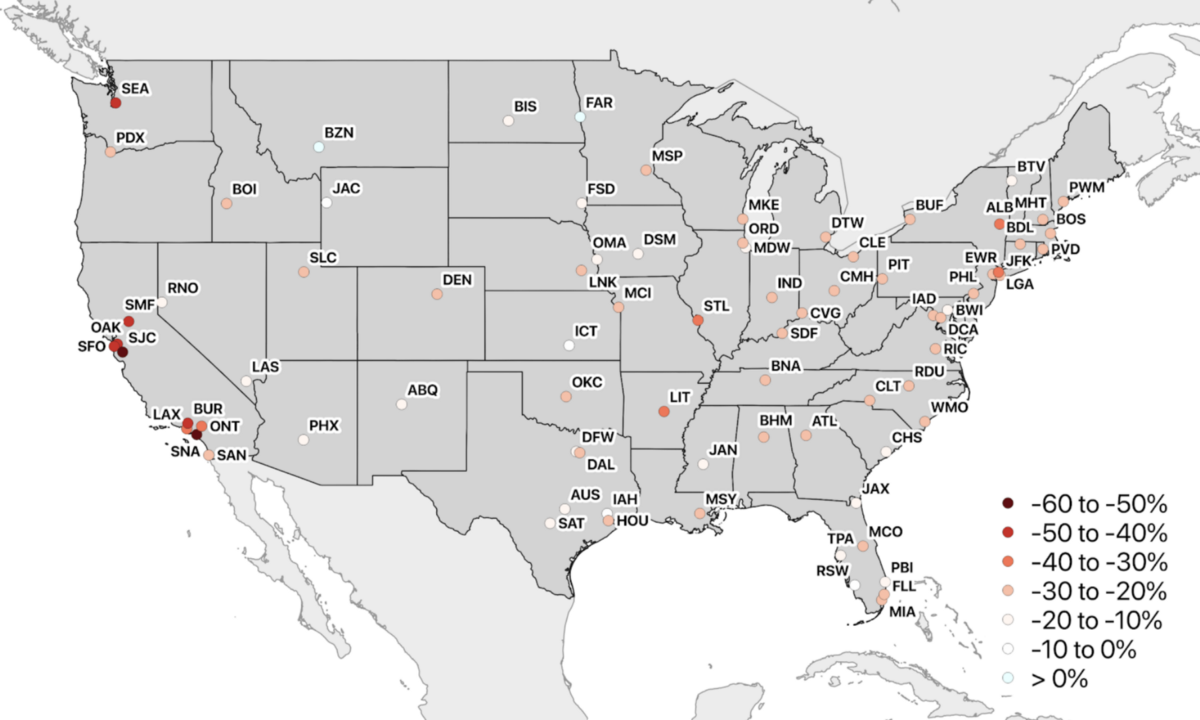
In this example, we show a percent change in total device counts per airport on March 9th-13th relative to February 10th-14th (four-week delta). Airports on the West Coast, and California in particular, showed decreases of 50% or more. The decrease in device counts at most other airports ranged from 20% or 40%. Only a handful of airports showed no change or small increases in activity.
Looking closer at a few of these airports in the plots below, we can see large decreases in daily unique device counts. Dark blue bars are weekends and light blue bars are weekdays.
Some major airports started to see declines as early as the last week in February and most experienced a large drop-off by mid-March. This was a consistent trend across most of the 85 US airports we looked at. We’ll continue to monitor airports and other facilities throughout the crisis to monitor the ongoing response and the eventual return to normal activity.
You may have seen our work in the New York Times correlating nitrogen dioxide (NO2) to the spread of coronavirus. NO2 is produced by vehicles and power plants, and heavy industries like cement manufacturing, and can be used as a broad proxy for mobility and economic activity, especially in recovery as movements increase.
The visualization below maps a time series of NO2 levels across Eastern China, Japan, and the Korean Peninsula using data from the European Space Agency’s Sentinel-5P satellite. Data from the satellite is collected daily and combined into 20-day “composite” images in order to filter out cloud-cover and other data quality effects that impact the signal.
The visualization starts on December 1st and continues through February 28th during both 2018–2019 (left) and 2019–2020 (right). The 20-day composite is shown as a window synced through time during each year.
In 2019, NO2 levels decline around the start of the Chinese New Year (February 5th) but appear to recover quickly afterward. Note the increase in NO2 over Wuhan around Feb 23rd. In contrast, NO2 levels during 2020 decline before the start of the Chinese New Year (January 25th) but never seem to fully recover.
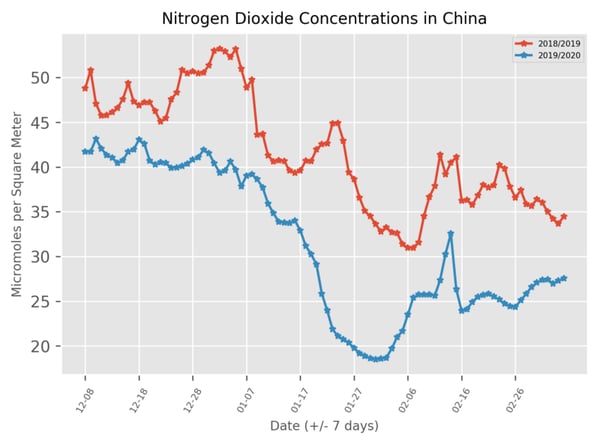
When we take an average of NO2 levels by date across all of China and plot each yearly period on a graph, we can see declines in both years leading up to the start of Chinese New Year, though the decline in 2020 is more pronounced.
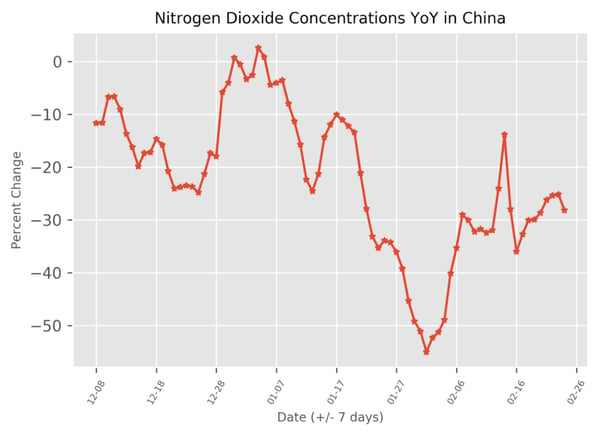
Plotting the percent change in NO2 from the prior year, we see declines of nearly 60%. Chinese New Year is set to Jan 25 in each yearly period for a more accurate year-over-year comparison in the chart below.
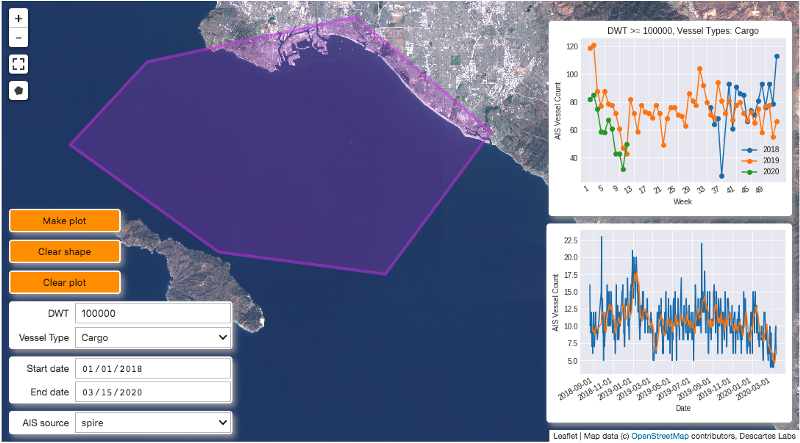
Another powerful example of the data we work with is radio signals from Automatic Identification System (AIS) devices on ships, required to broadcast their location and characteristics. In its raw form, AIS data is noisy, requiring cleaning and cross-referencing with outside datasets before it can be used effectively.
Over the years, we’ve successfully ingested and cleaned multiple sources of AIS data into our platform, giving us the ability to monitor vessel movements and shipping activity around the world. An example of this capability is our ability to detect and interpret disruptions in the global economy due to coronavirus. Initially, as the free movement of people throughout China limited economic activity we were able to monitor two distinct changes in the market:
In this post, we’ll take a brief look at decreased exports to the US.
The Port of Shanghai is a large exporter of finished goods, generally transporting these products in container ships. When those products are exported to the United States, they often enter at the Port of Long Beach.
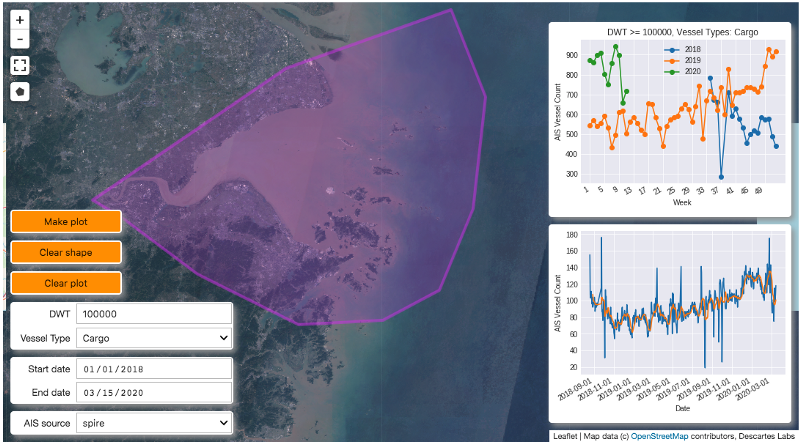
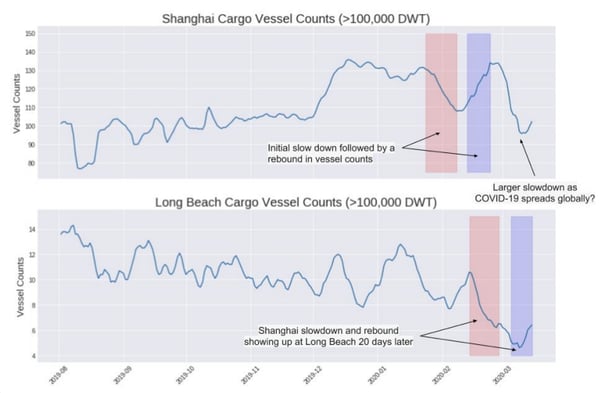
In the graphic below, we measure an initial decrease in vessel counts in the Port of Shanghai shortly after Chinese New Year (top chart, red). Then, about 20 days later, we see a decrease in the number of container ships carrying goods into the Port of Long Beach (bottom chart, blue). 20 days is also the average travel time from Shanghai to Long Beach. Once activity rebounds in Shanghai (top chart, blue), we see them increase in Long Beach as well, approximately 20 days later (bottom chart, blue).
Our customers are already leveraging these signals and many other capabilities on our platform to detect signs of early stabilization in the supply chains they care about. Call or contact us directly to build yours. We can help customize indicators to your area of interest and build the best possible alerting system for your business.
We’ll continue developing tracking activities and share new visualizations and insights as the situation develops. And since we believe in promoting scientific use of our platform, we encourage researchers to apply for our Impact Science Program with ideas to help monitor the socio-economic consequences of the pandemic using geospatial analytics.
As the impacts of coronavirus spread throughout the world’s economies, our platform can provide a powerful signal into the supply and demand dynamics of the global economy. While it is easiest to see the declines in economic activity today, the eventual recovery of economies will be evident as well.
Please visit our platform page, industries page, resource library, or API documentation to learn more.
Note on our use of mobile device data: Location data, as reported by mobile devices, is a powerful resource to understand our world and monitor aggregate change in human behavior in times of crisis. While there are legitimate privacy concerns associated with location data, coronavirus demonstrates that there are important applications for this data to address some of the more vexing challenges we face in a world where society and economies are more complicated than ever before. Consistent with industry norms, we source data that is de-identified, and we do not use it to identify an individual. All resulting analysis is then statistically aggregated, removing the ability to characterize the behavior of any single device.