Article category: Science & Technology
Mapmaking in the Age of Artificial Intelligence
Let’s cut to the chase. Artificial Intelligence (A.I.) is a buzzword that is applied to so many...
Note: This post was updated on January 3, 2019 to clarify that lidar was used as ground truth data to train the model only. Lidar is not needed to run the model; it requires only ~1m resolution four-band imagery (near infrared, red, green and blue) as inputs.
Much fuss has been made over city trees in recent years. Urban trees reduce crime and help stormwater management (yay!). Cities and towns across the U.S. are losing 36 million trees a year (boo!). But, hold up—climate change is accelerating the growth of urban trees in metropolises worldwide (boo/yay?). Urban trees are under such scrutiny right now that the U.N. even had a World Forum on Urban Forests a few weeks ago to discuss the planning, design and management of urban forests and green infrastructure.
All this fuss is not without good reason. Trees are great! They make oxygen for breathing, suck up CO₂, provide shade, reduce noise pollution, and just look at them — they’re beautiful!
The thing is, though, that trees are pretty hard to map. The 124,795 trees in the San Francisco Urban Forest Map shown below, for example, were cataloged over a year of survey work by a team of certified arborists. The database they created is thorough, with information on tree species and size as well as environmental factors like the presence of power lines or broken pavement.
But surveys like this are expensive to conduct, difficult to maintain, and provide an incomplete picture of the entire extent of the urban tree canopy. Both the San Francisco inventory below and the New York City TreesCount! do an impeccable job mapping the location, size and health of street trees, but exclude large chunks within the cities, like parks.
This data gap is neither accidental nor purposeful. As described in this tweet from SF Urban Forest, the trees they mapped were a product of bureaucratic choices and limitations—such as the case of mapping private property — and moving beyond those choices and limitations may take some time, if it happens at all.
The maps should include all trees, right? The SF map evolved this way based on what data was available, which agencies were involved, what the priorities were, how the grants were written, etc. Hard to say when more will be added. (For trees on private property it won't be soon).
— SF Urban Forest (@UrbanForestMap) December 18, 2018
So, what’s the solution if we want to map tree canopies in places with such complex geographies? How do we fill in the gaps between official street tree census and trees in parks and on private property?
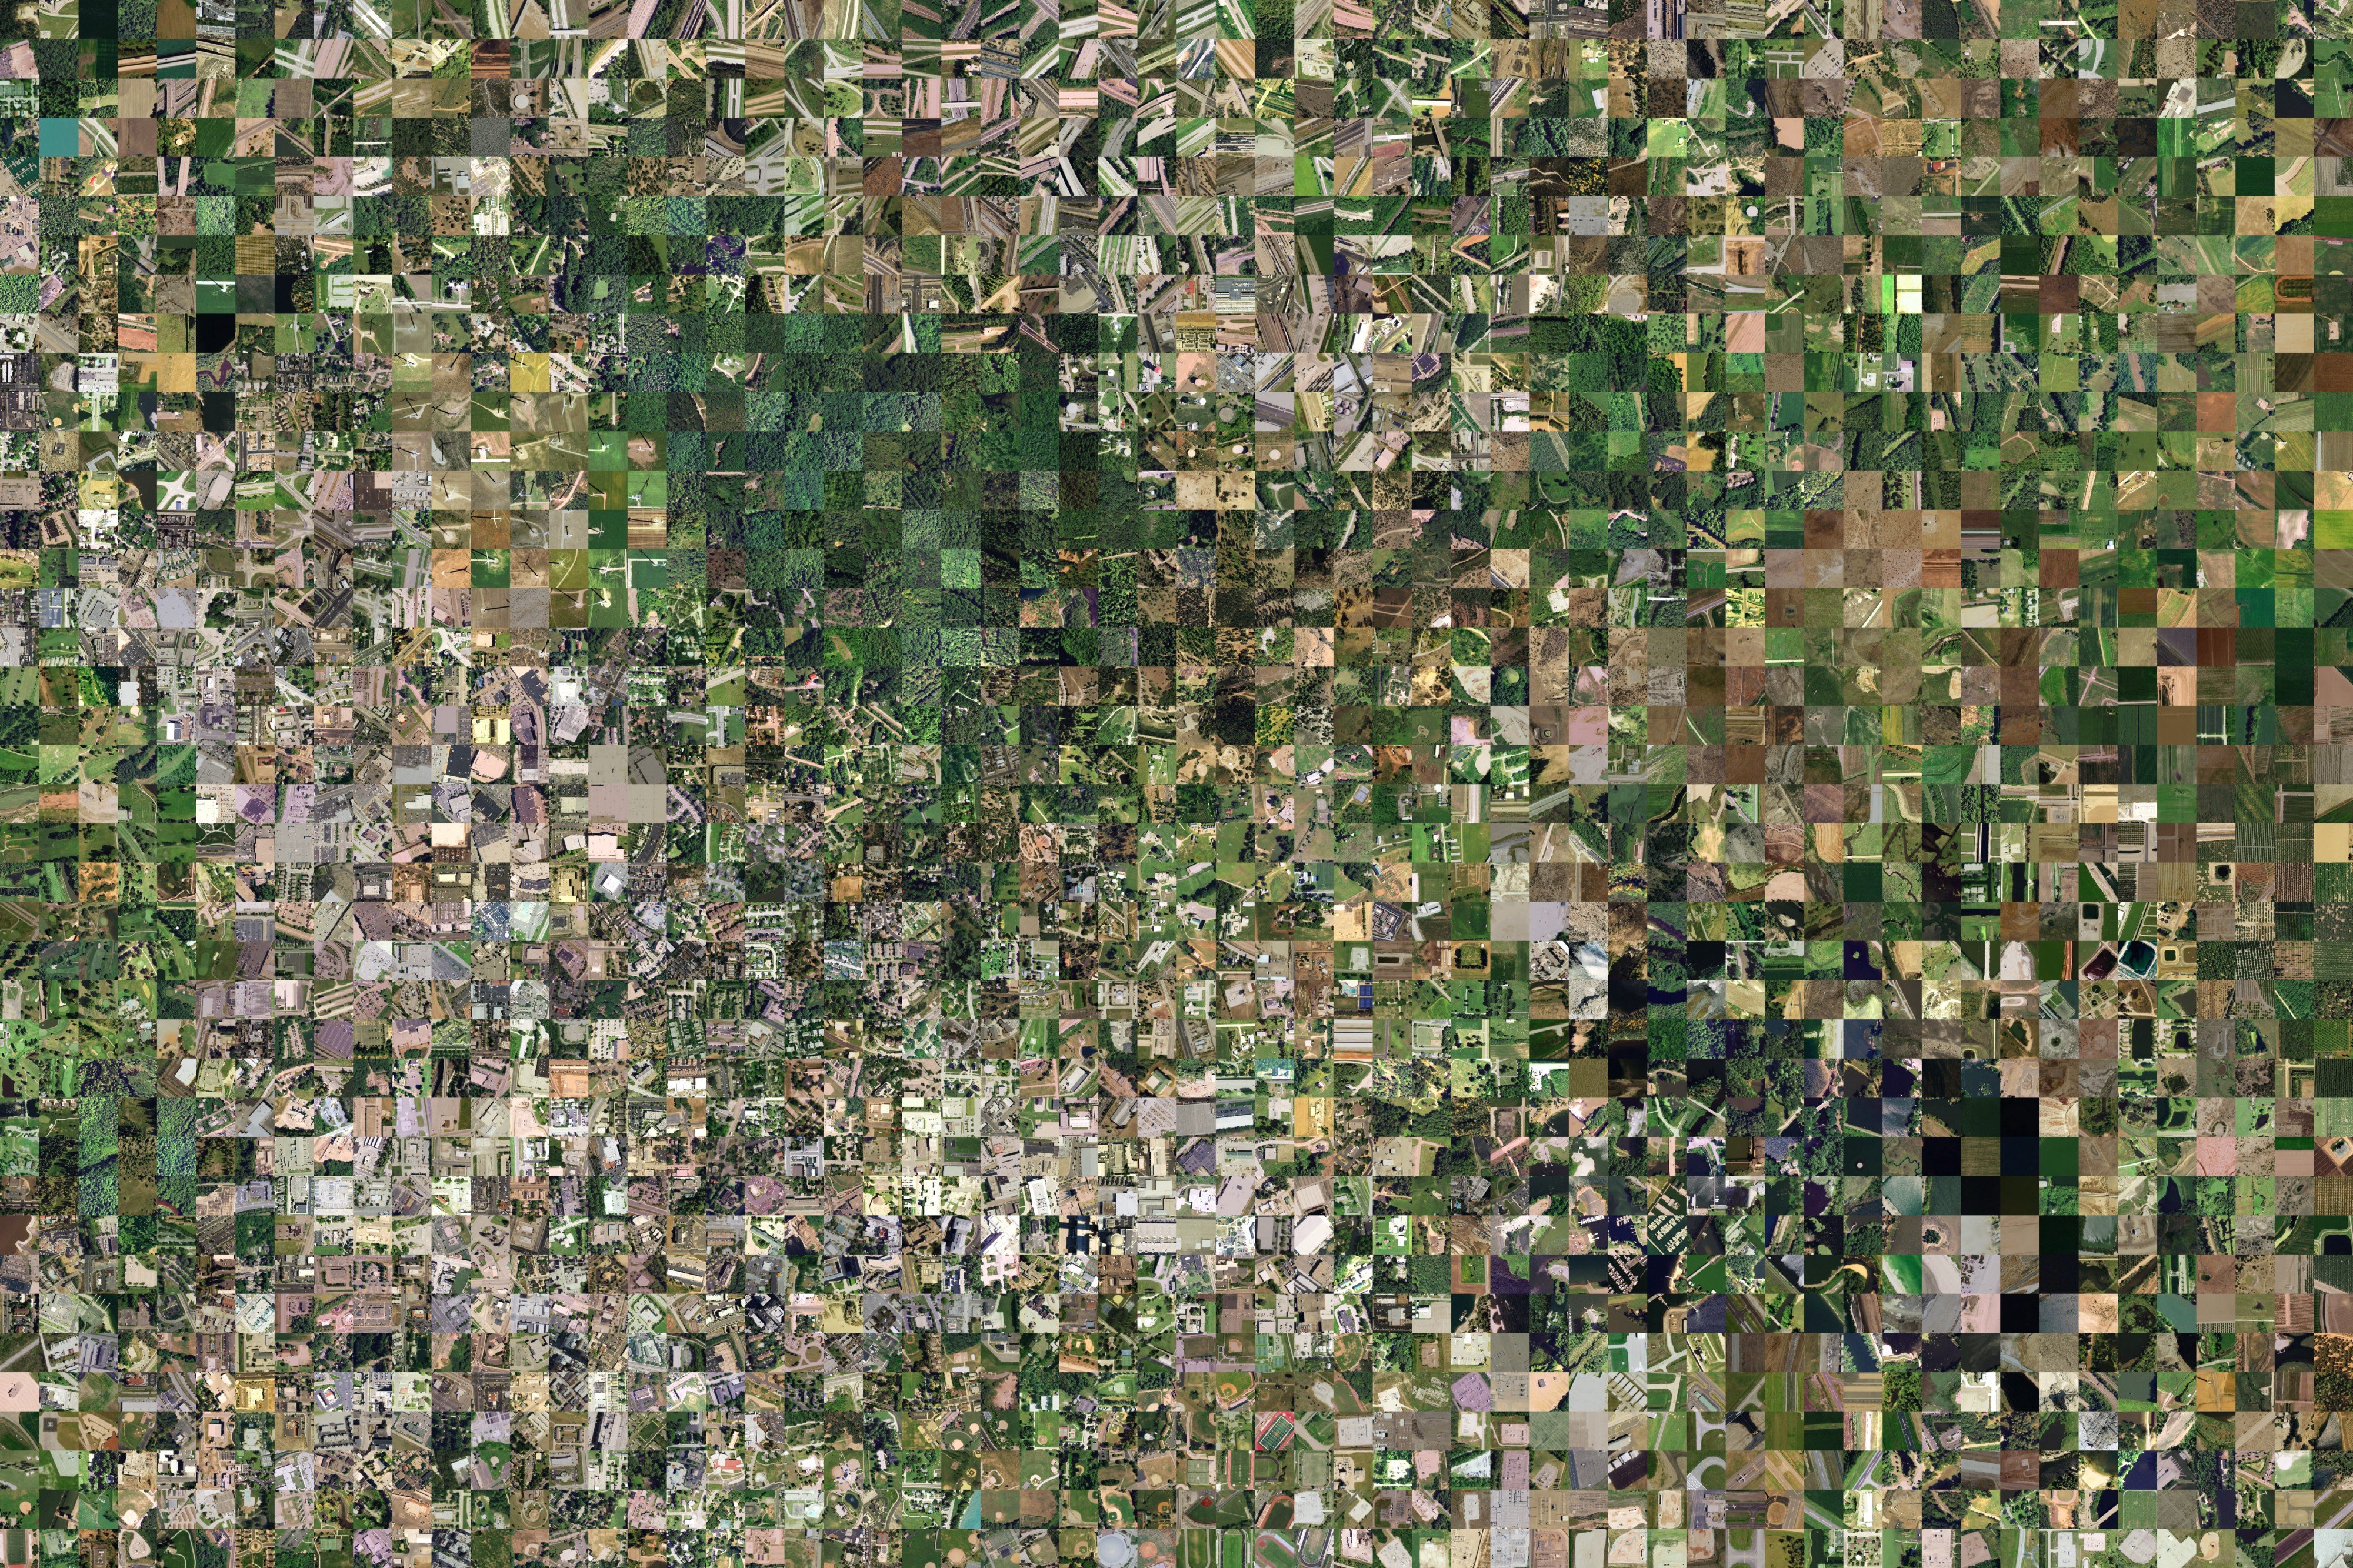
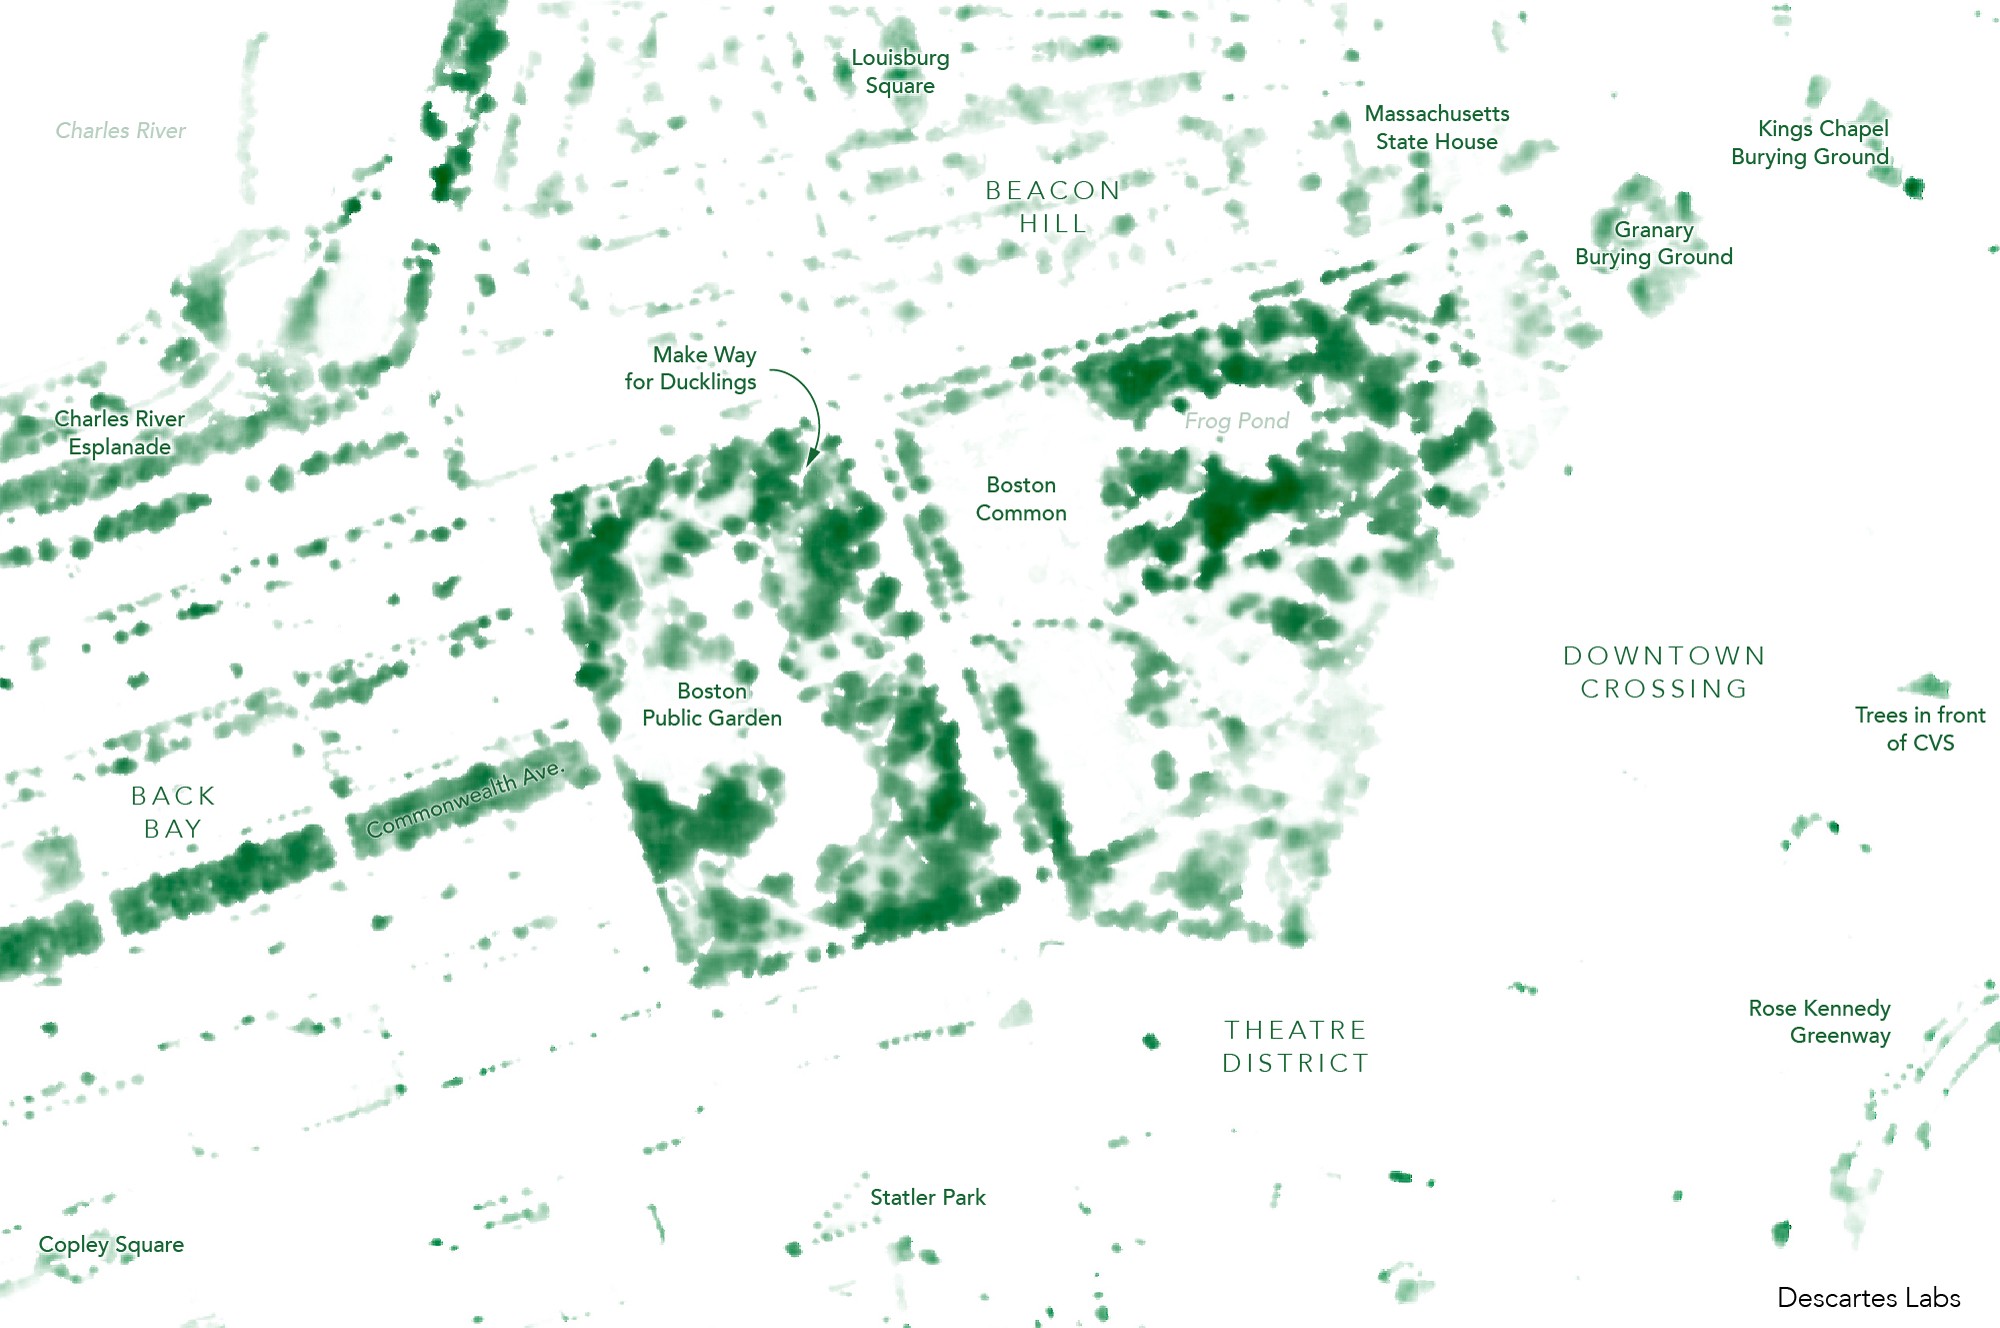
Some savvy folks might reply, C’mon, can’t we just fake it with a vegetation map? Everyone’s all over NDVI these days, right? Well… it’s not exactly that easy. Take a look at Boston below. Trees are only part of what’s green across the region.
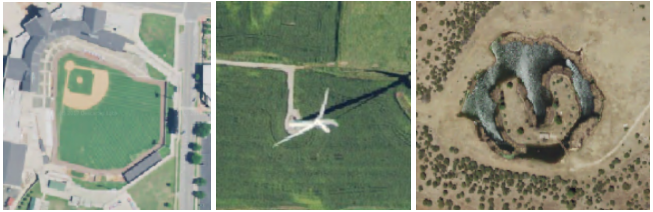
So Descartes Labs summer intern, Aidan Swope, built a machine learning model to identify tree canopy from satellite imagery. To train the model, he identified known locations of tree canopy using lidar data and NAIP imagery over California. Using that as ground truth, the model was trained to classify which pixels contain trees in the corresponding satellite images. The result is a machine-learning model that has learned to identify trees just using four-band high-resolution (~1 meter) satellite or aerial imagery—no lidar required! This model can now be run anywhere in the world with high-resolution satellite imagery.
Here’s the area surrounding the Boston Common, for example. We clearly see that the Public Garden, Common and Commonwealth Avenue all have lots of trees. But we also see some other fun artifacts. The trees in front of the CVS in Downtown Crossing, for instance, might seem inconsequential to a passer-by, but they’re one of the biggest concentrations of trees in the neighborhood.
The classifier can be run over any location in the world where we have approximately 1-meter resolution imagery. When using NAIP imagery, for instance, the resolution of the tree canopy map is as high as 60cm. Drone imagery would obviously yield an even higher resolution.
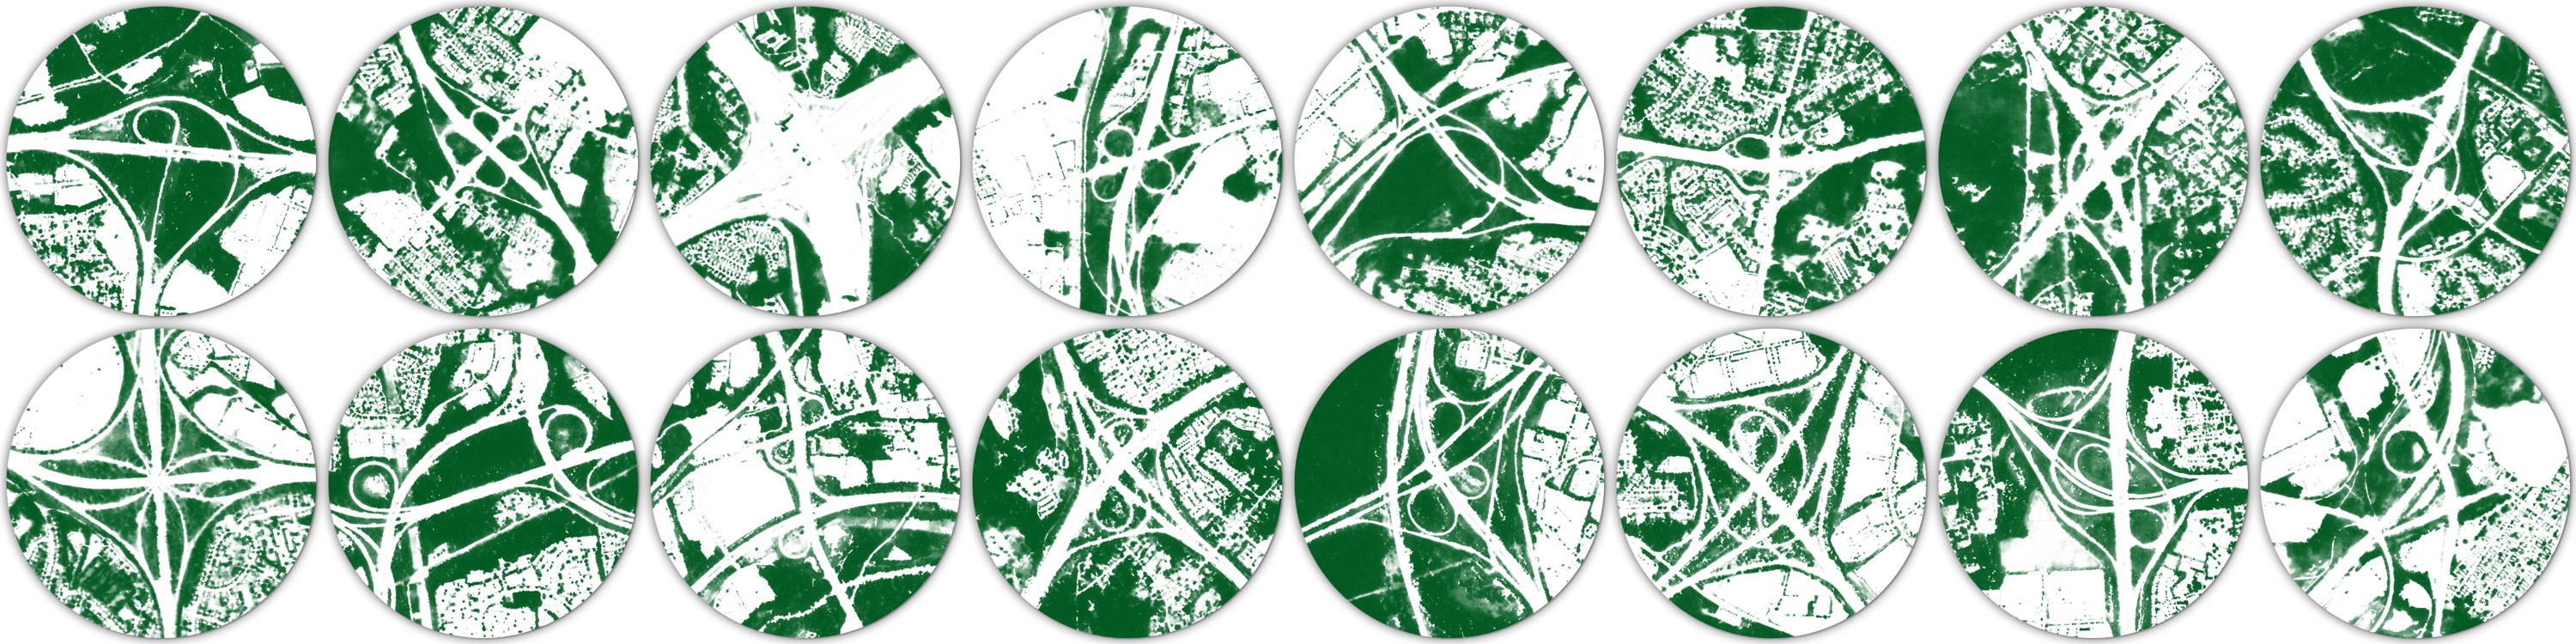
The ability to map tree canopy at a such a high resolution in areas that can’t be easily reached on foot would be helpful for utility companies to pinpoint encroachment issues—or for municipalities to find possible trouble spots beyond their official tree census (if they even have one). But by zooming out to a city level, patterns in the tree canopy show off urban greenspace quirks. For example, unexpected tree deserts can be identified and neighborhoods that would most benefit from a surge of saplings revealed.
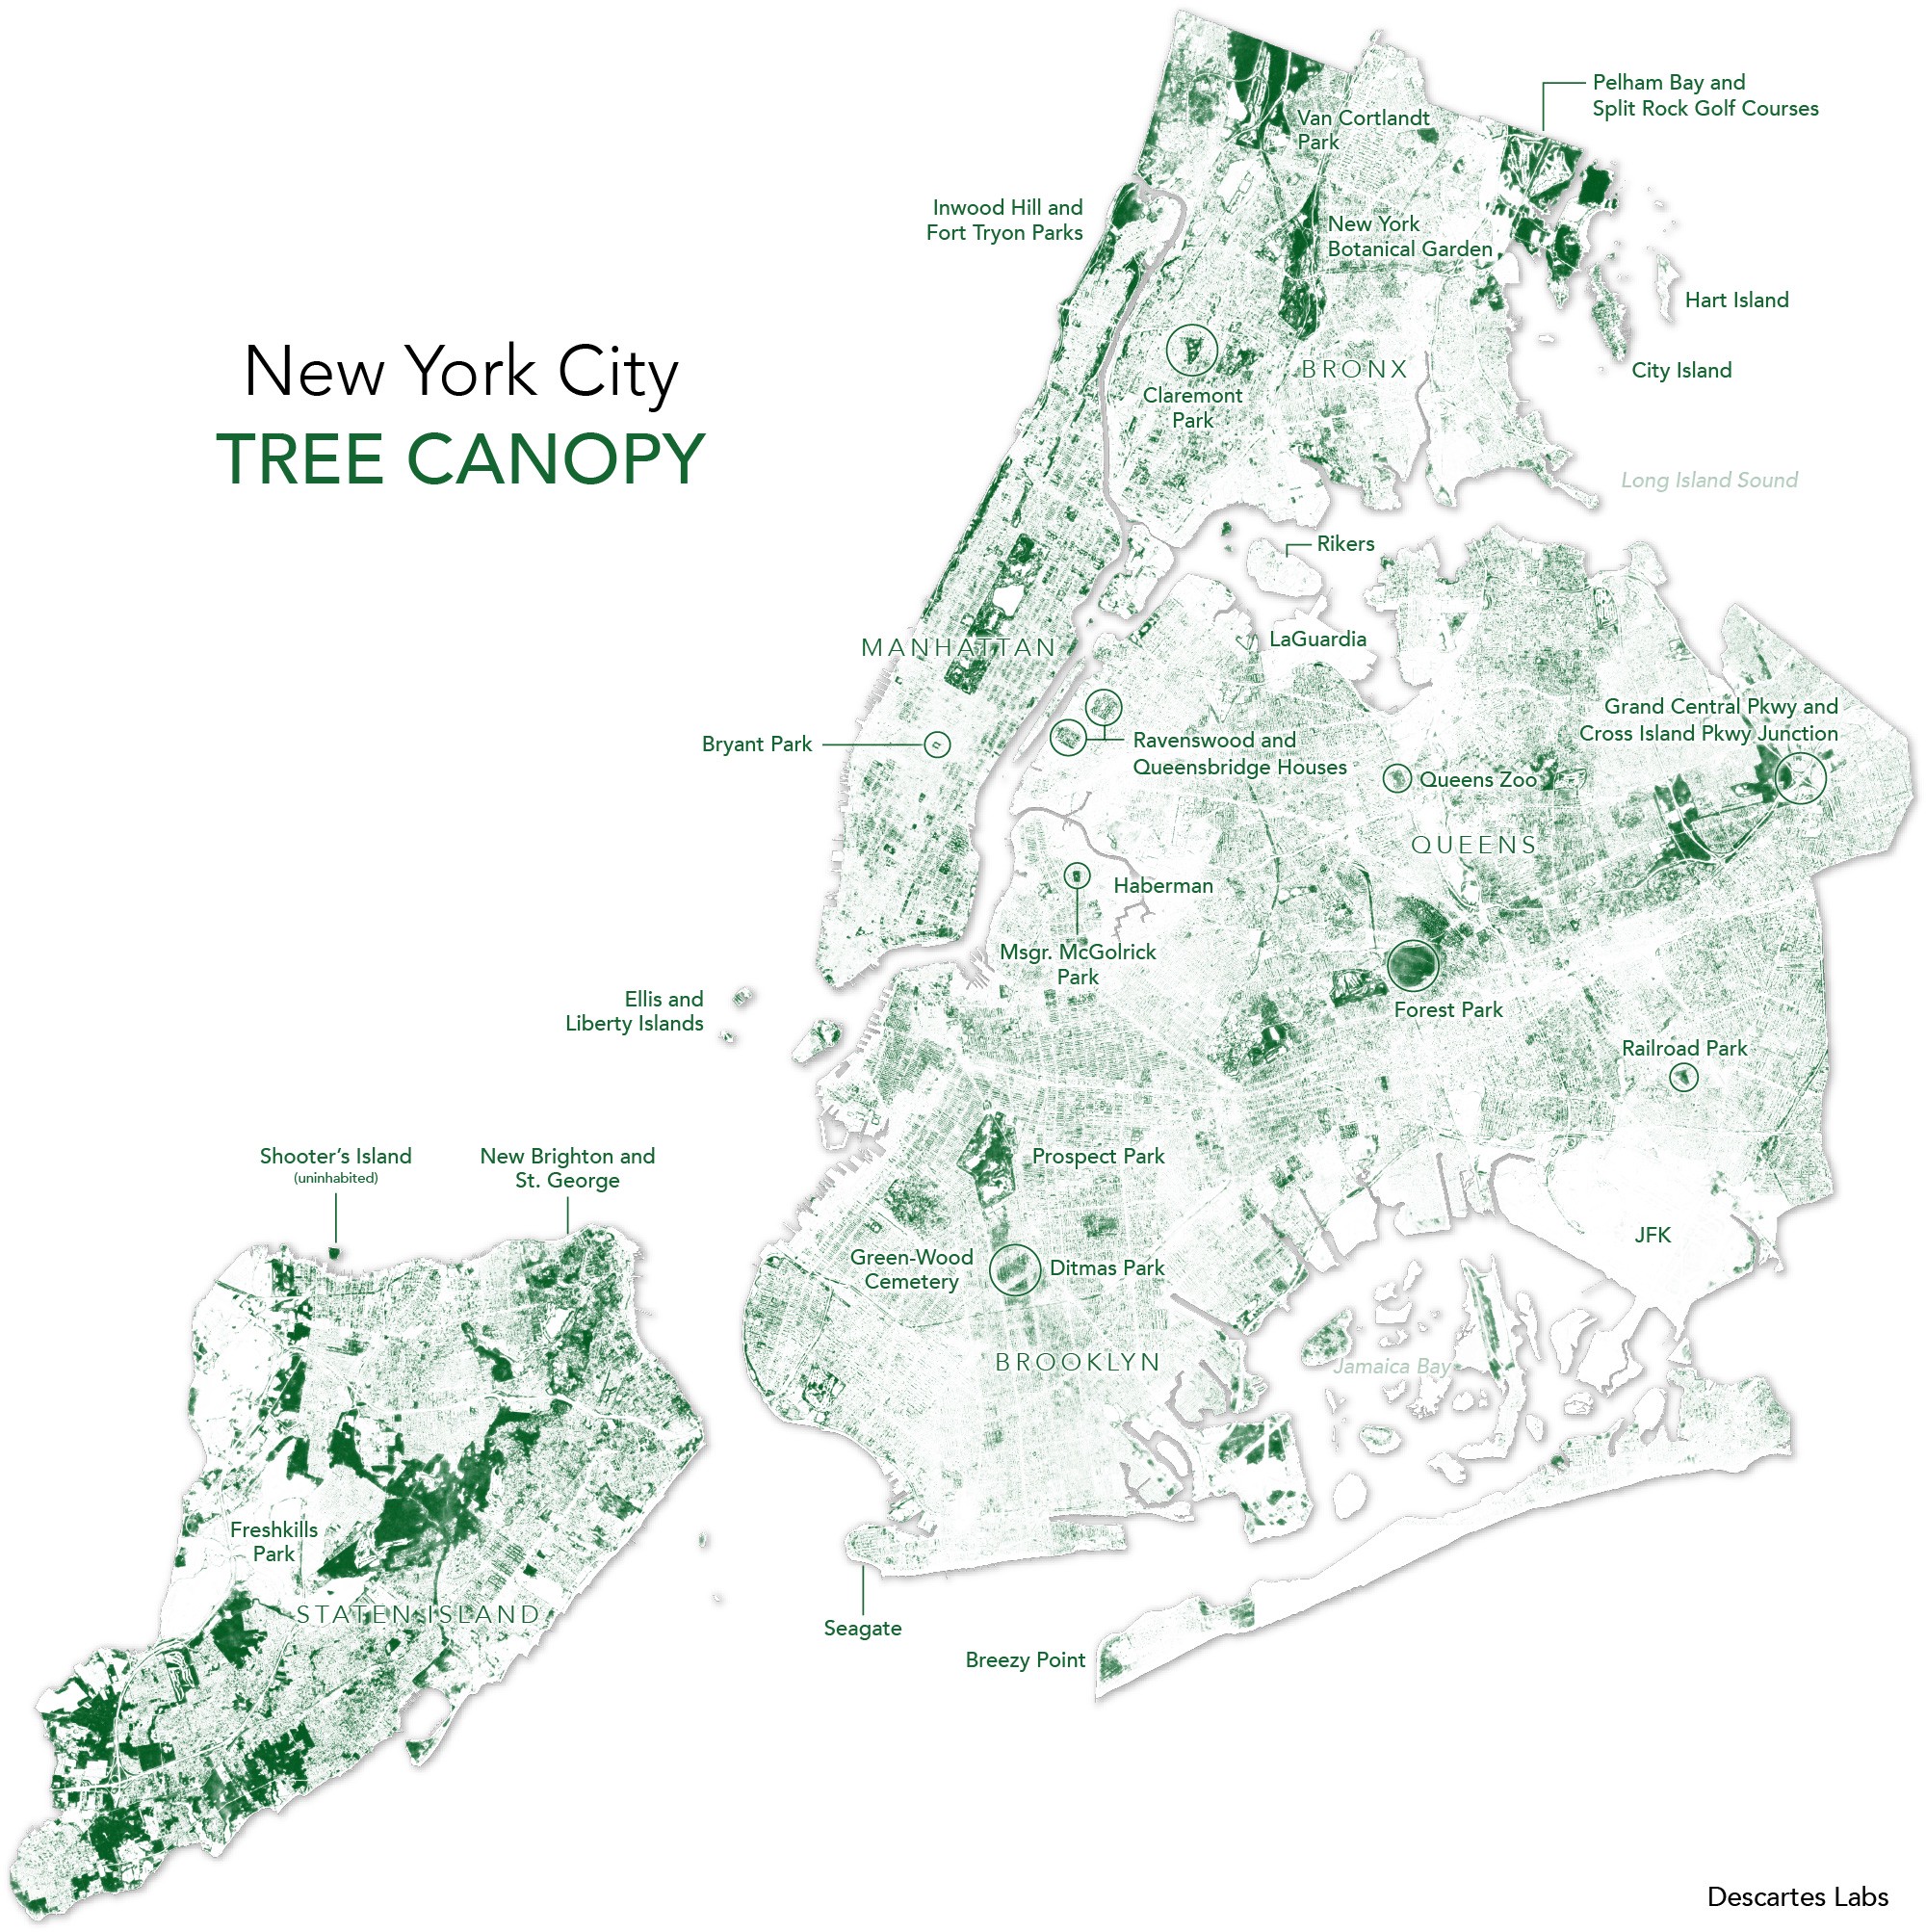
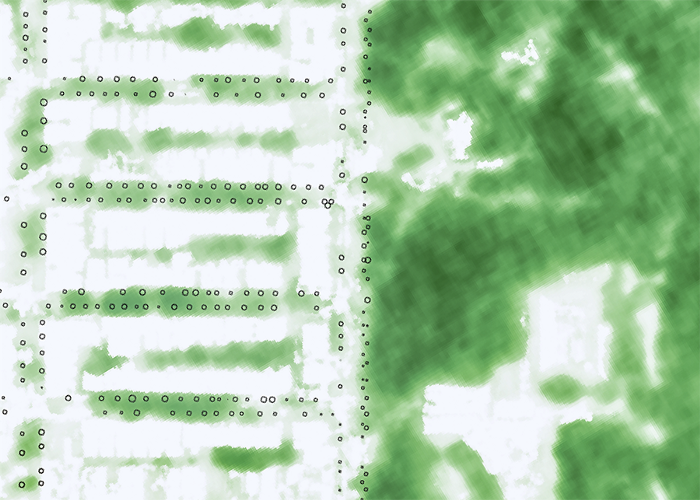
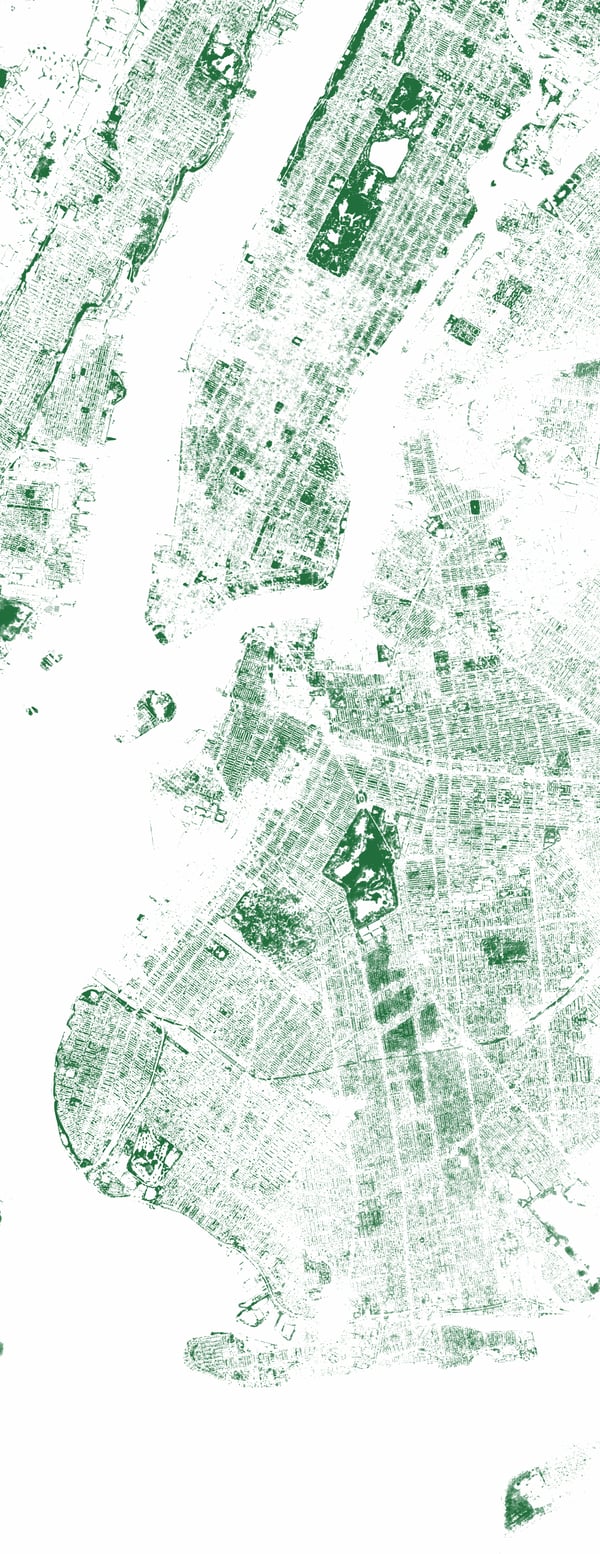
Below is a parting shot. Scroll through this New York City tree image and notice how the landscape of trees ebbs and flows throughout. Trees blanket parks, cemeteries, housing development courtyards, the streets of affluent residential neighborhoods like the West Village and The Upper East Side, and the edges of rail lines (that’s a freight rail line that cuts across Brooklyn east to west!). But trees have been pushed out of highly-trafficked areas like Times Square and Downtown Brooklyn.
The pattern of trees in any city reveals something about its urban planning history and legacy of greenspace. Just looking at these, don’t you want to know what your city’s treescape looks like?
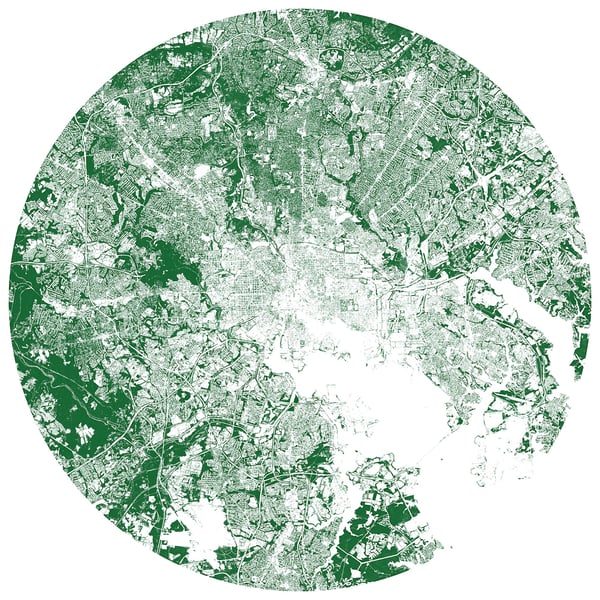
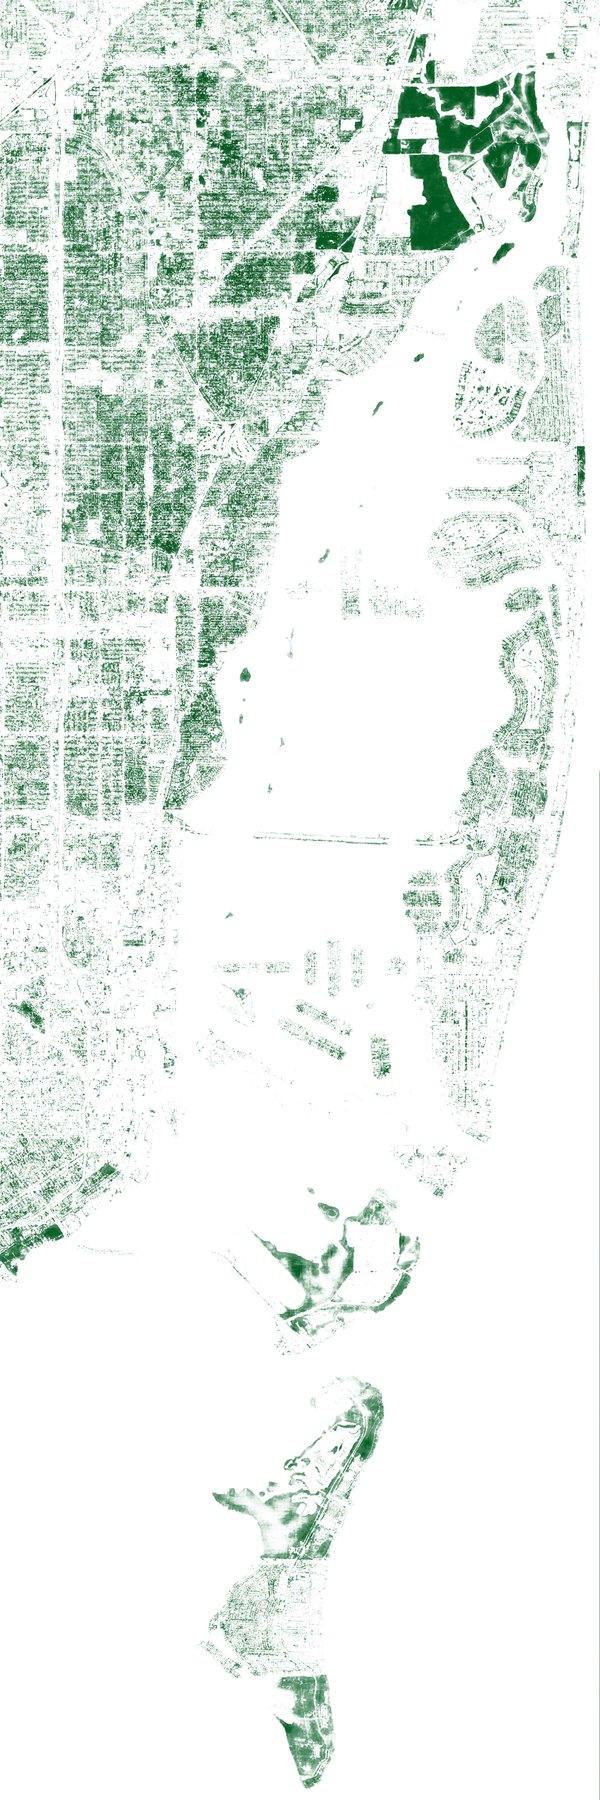
Also, Miami!
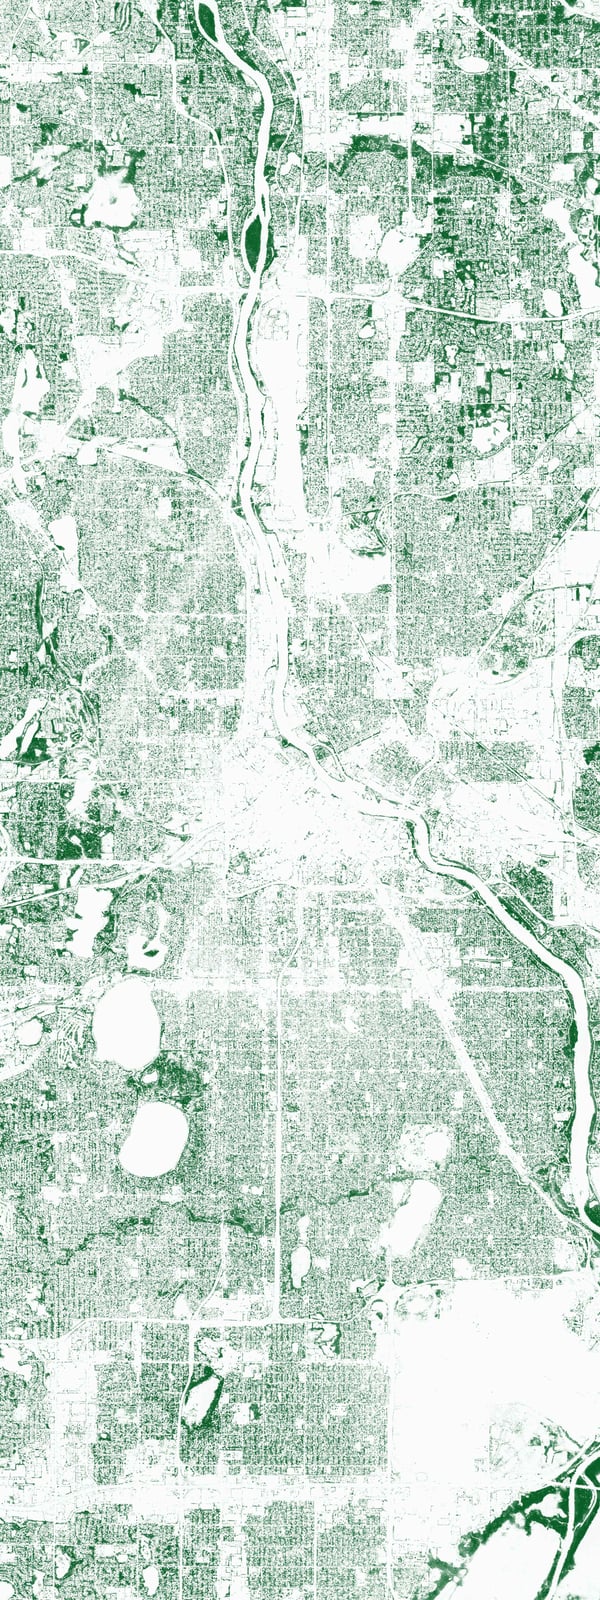
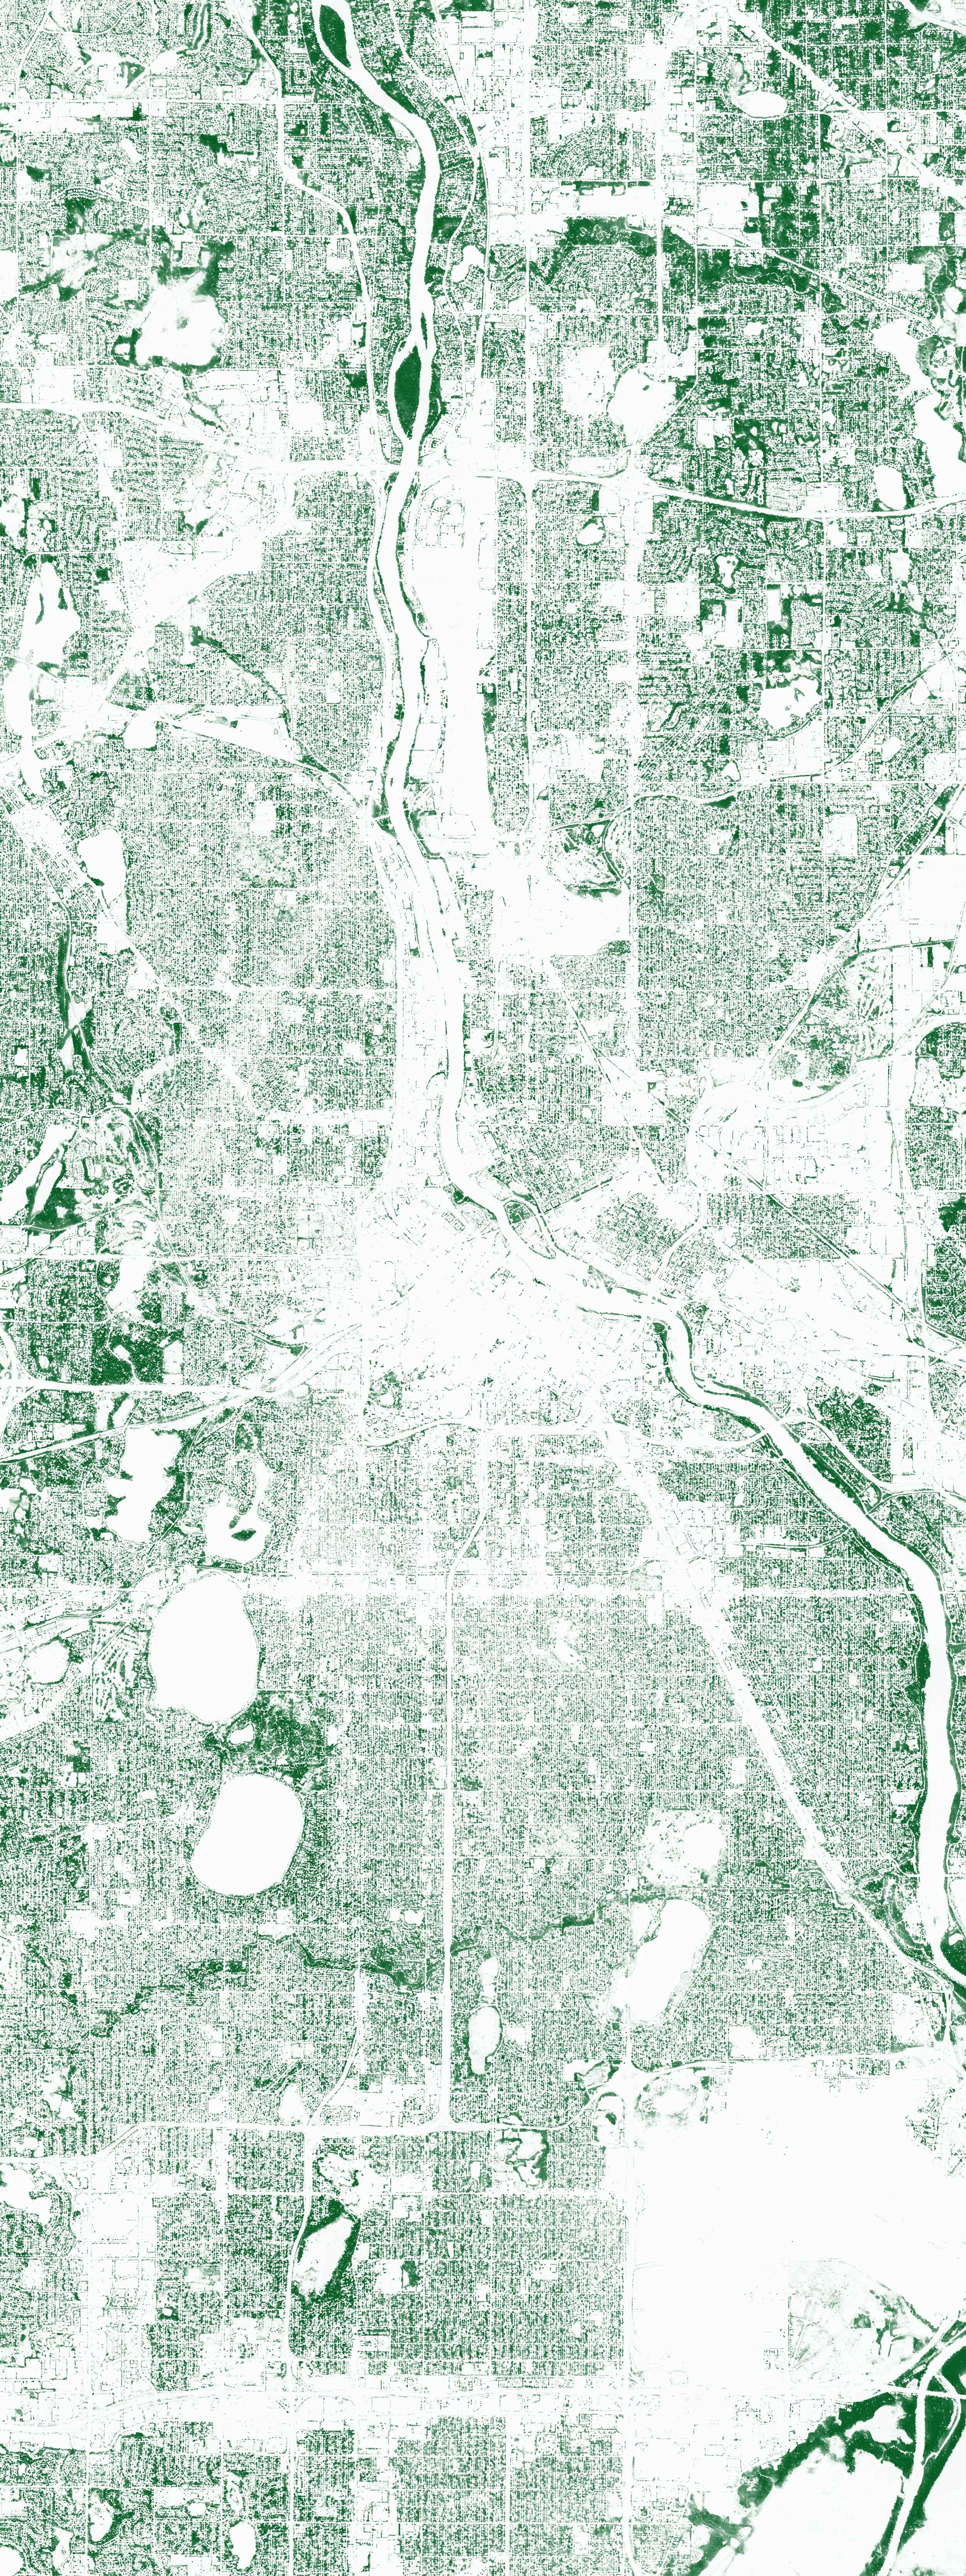
Oh, and why not Minneapolis too?