Article category: Mining, Science & Technology
SAR Technical Series Part 4 | Sentinel-1 global velocity...
Descartes Labs uses interferometric products to a build global geospatial data product that detects...

In early May, the Kilauea volcano on the big island of Hawaii started to erupt again. Technically, the volcano has been erupting for the past 35 years, but recent activity has raised concerns. New fissures have opened up, 19 at last count, in an area unaffected since the 1950s. As a result, many homes have been consumed by slow moving lava and thousands of people have been evacuated. More communities are being threatened by the advance of new fissures.
The Descartes Labs Platform offers an extensive catalog of imagery for examining important phenomena like this within days of their occurrence. Volcanic activity often leads to displacements in the Earth’s surface. These displacements are often too small to be seen with optical imagery, but, under the right conditions, can be measured using synthetic aperture radar (SAR). In this case we are using the SAR system onboard the European Space Agency’s (ESA) Sentinel-1 satellites.
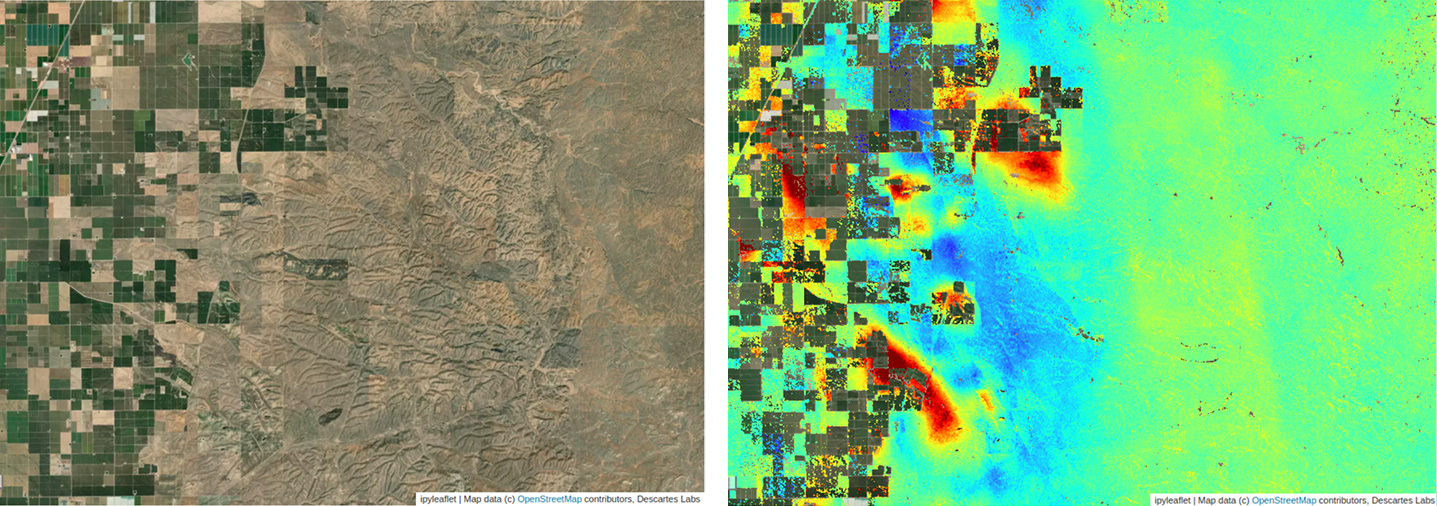
To begin, a satellite makes a pass over an area while emitting microwaves. An image is formed by assigning to each pixel the strength of the reflected signal from the corresponding patch of ground. In addition, each pixel has the phase of the reflected signal, which provides partial information about the distance between the satellite and the pixel during the collection. A second image is collected sometime later. By overlaying the two images, and plotting the per-pixel phase difference, the surface deformation occurring between the collections of the two images can be observed. This method is an example of interferometric SAR (InSAR).
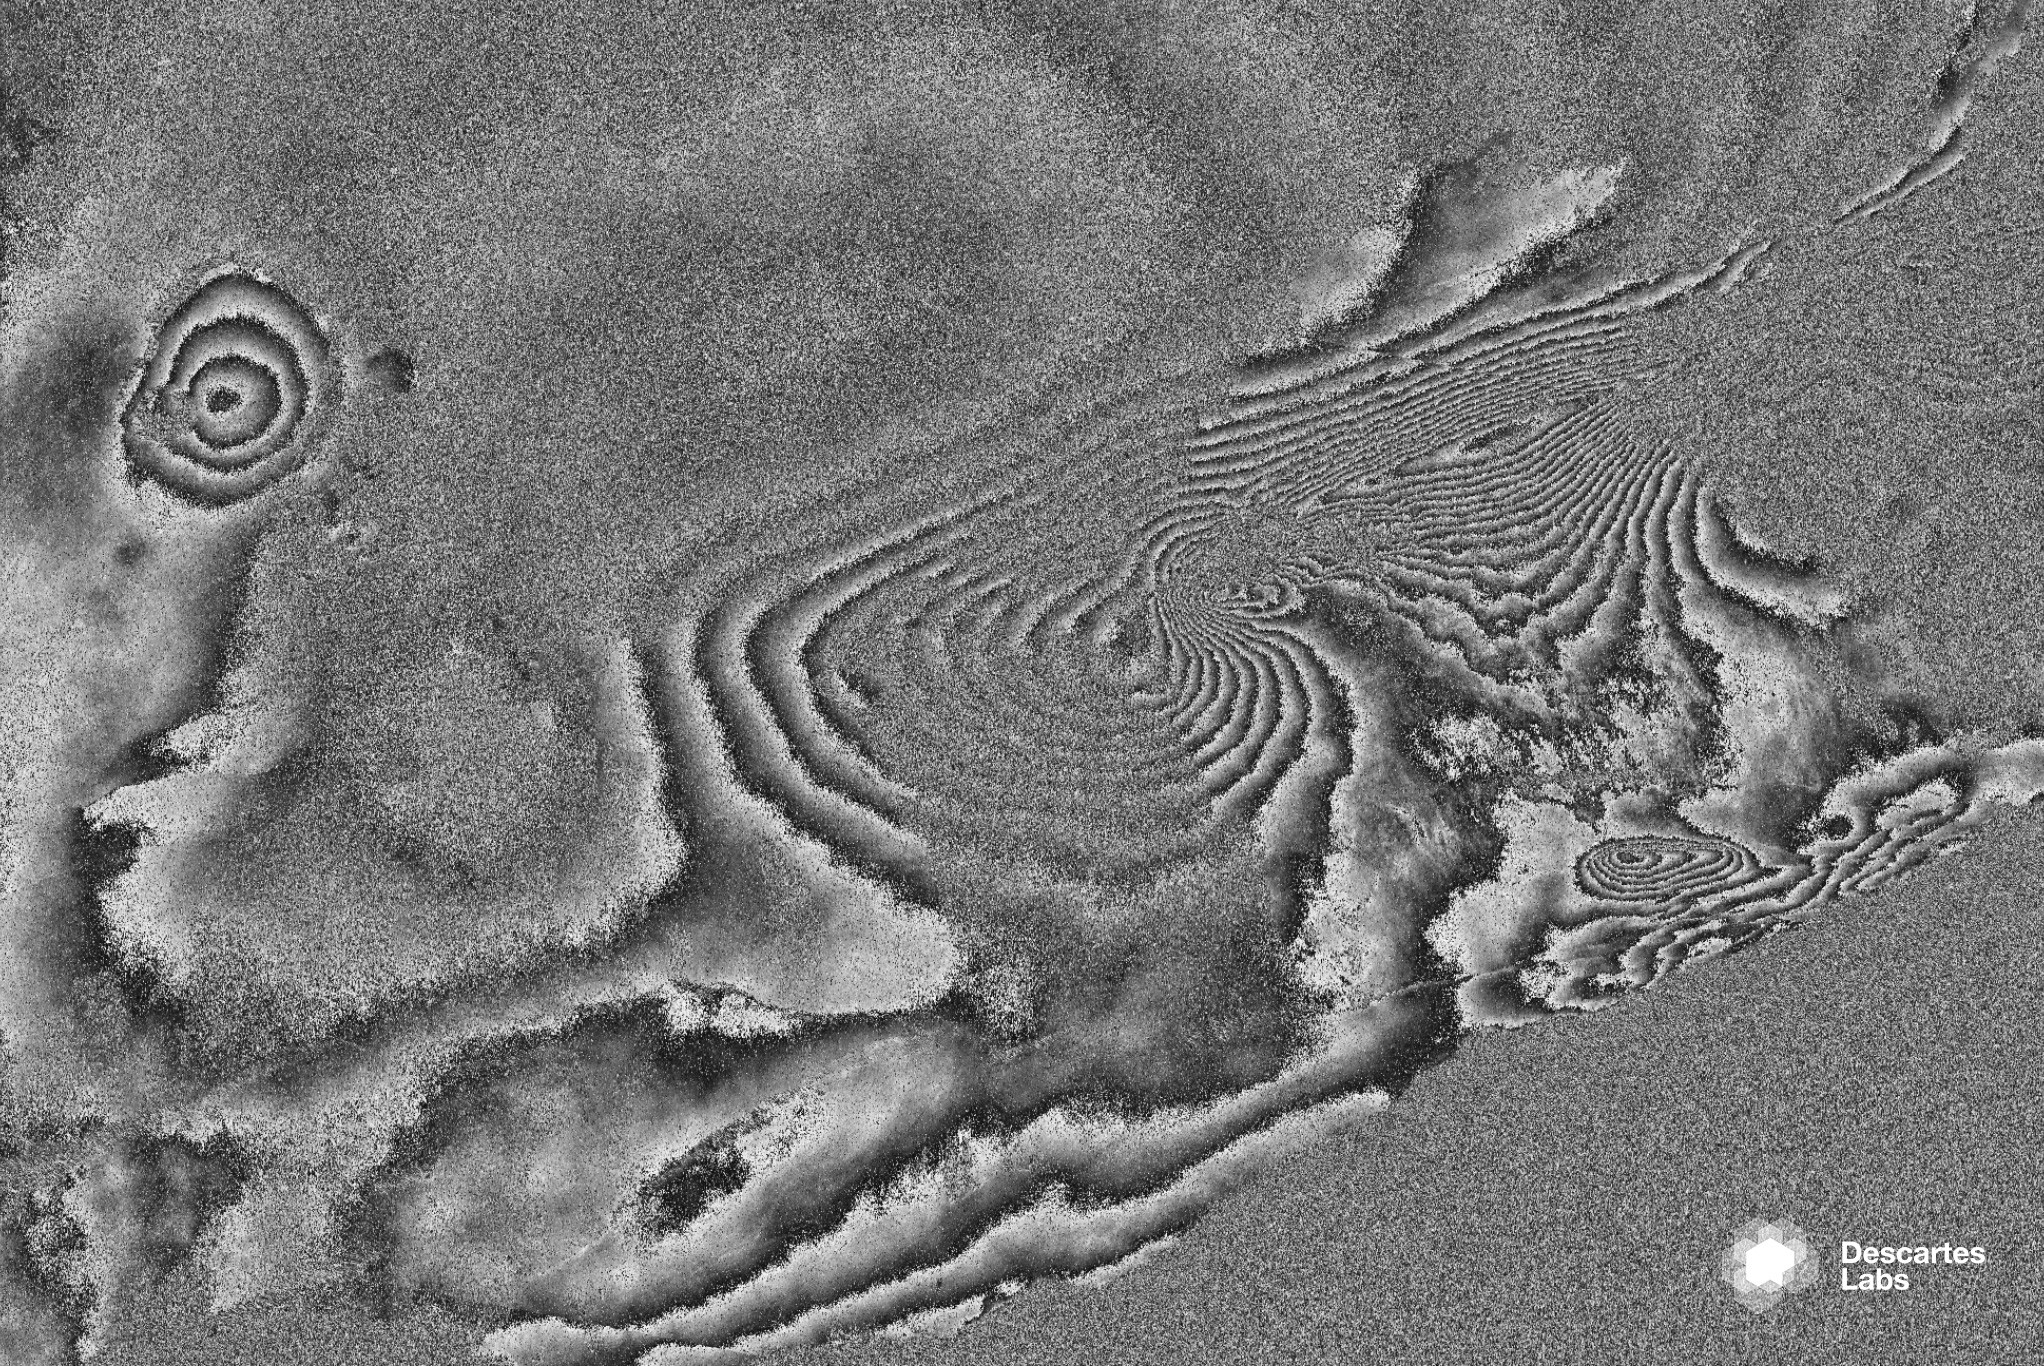
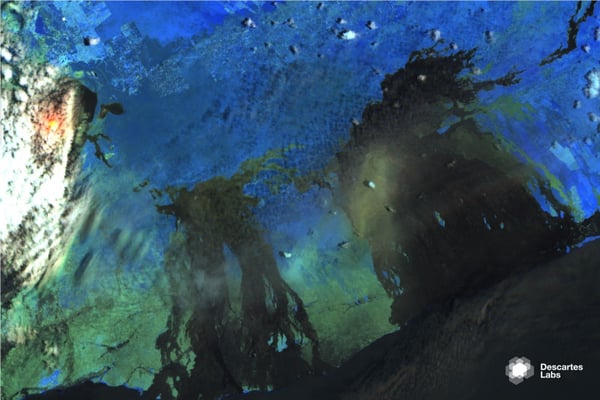
In Figure 1, the fringes indicate large areas shifting along the satellite’s line of sight between the two collections. The first collection occurred April 23, and the second collection occurred 12 days later on May 5. The wavelength of Sentinel-1 is roughly 5cm, and so a change in roundtrip distance of 5cm between the collections, or a surface deformation of half that, will correspond to a phase shift of a whole wavelength, which appears as a single fringe in this image. There are four fringes in the left feature, suggesting that the deformation is 10cm at the middle of the fringes. When we look at near infrared and shortwave infrared imagery in Figure 2, collected May 3 by ESA’s Sentinel-2 system, the heat from the lava stands out as orange, showing the proximity of the deformation to the volcano crater.
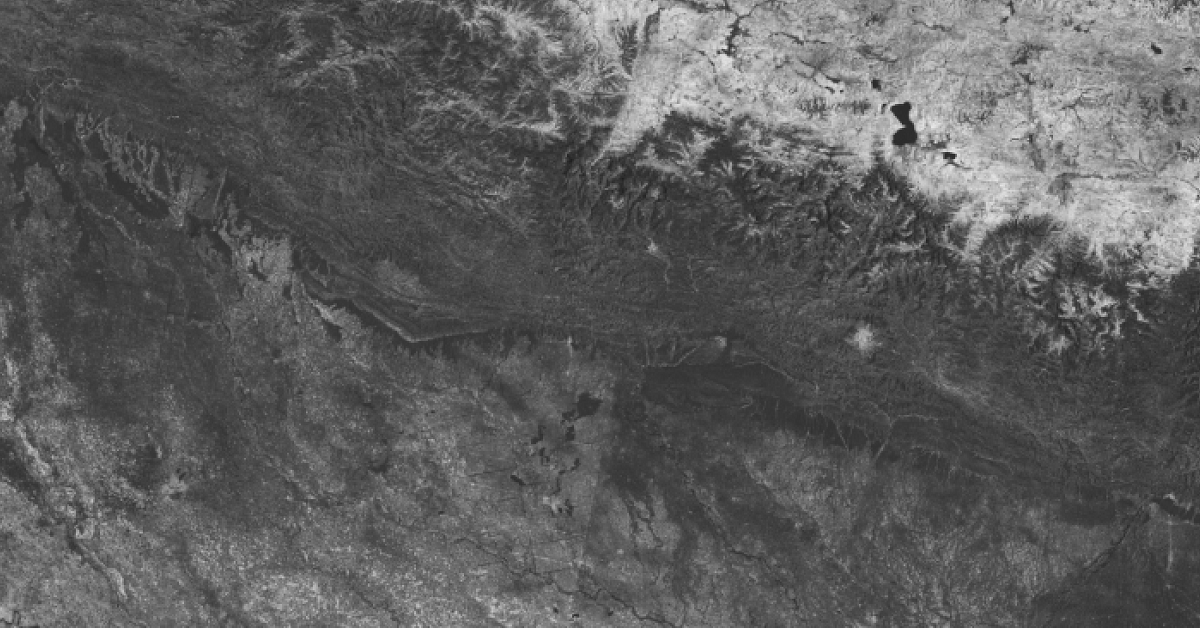
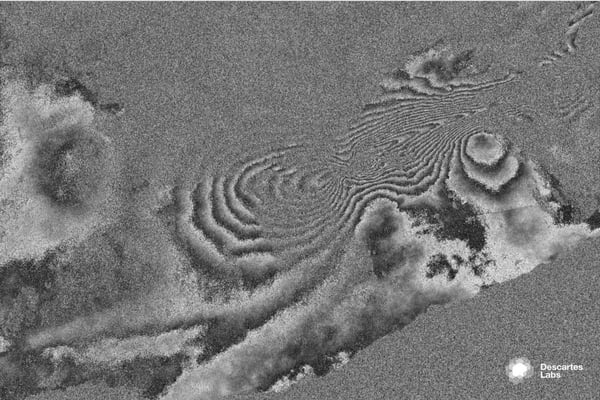
While InSAR is a powerful technique, it also has certain subtleties. First, SAR systems cannot image the ground by looking directly downward, and, instead, view the ground at a slant that is largely perpendicular to the direction of flight. In Figure 1, we have a view that was taken from collections while the satellite was looking West at the island. In Figure 3, we have a view from collections taken during roughly the same time period while the satellite was looking East at the island. Note that the fringes near the volcano vanish and the remaining fringes have shifted in location. By combining the multiple InSAR images a more complete understanding of surface deformation is exposed.
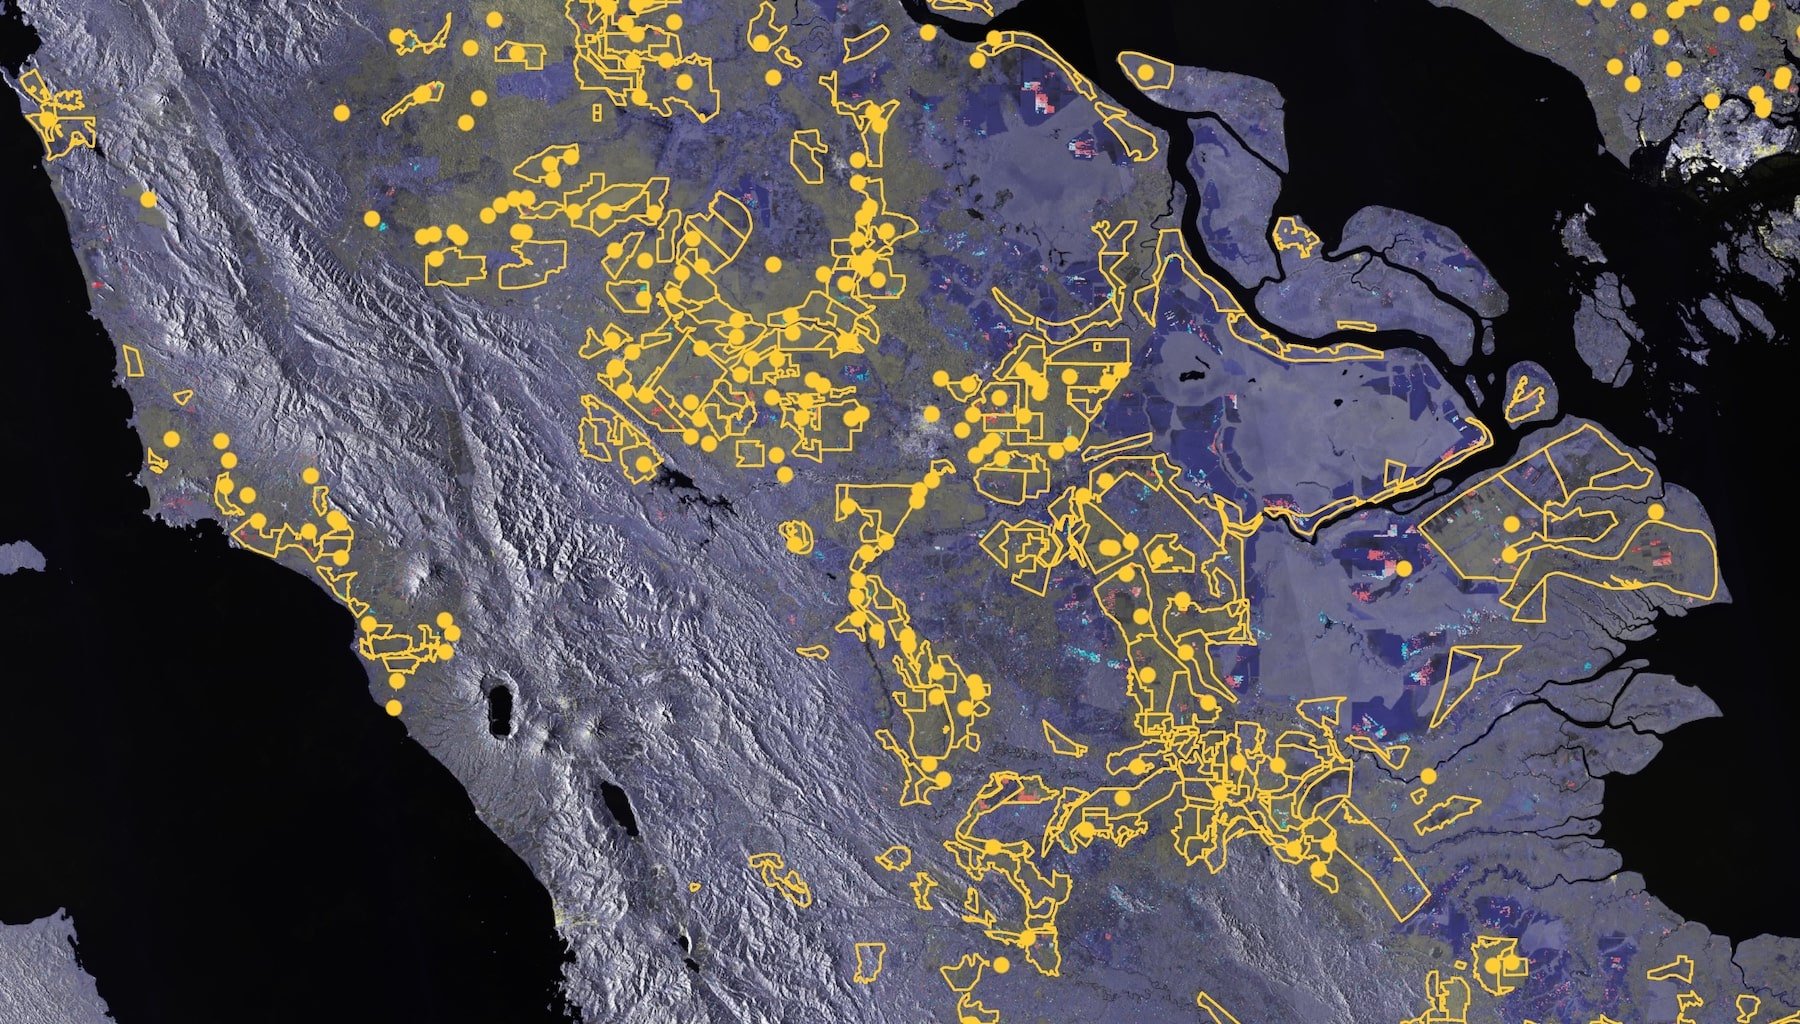
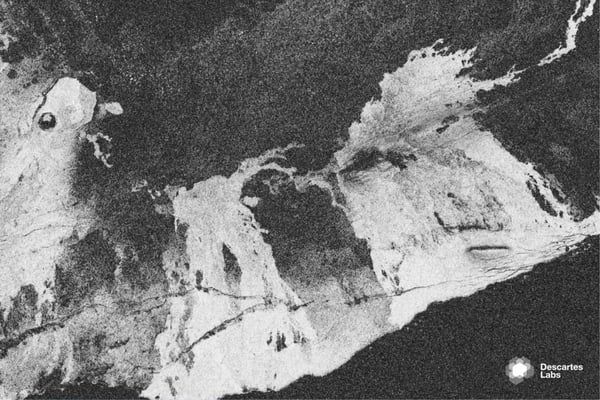
Another important issue regarding InSAR is that phase shift measurements require a fairly uniform deformation over several hundred meters. Leaves on vegetation introduce wavelength sized changes within each pixel resulting in a phase measurement that is too noisy to be of use. Figure 4 shows a measure of the coherence between the collections used to form the interferogram in Figure 1. The areas that are light are those where one can trust the phase measurement. Outside of the high coherence areas the phase in Figure 1 become noisy, but it is important to bear in mind that deformations could occur there as well even though a phase measurement can’t be made.
The Descartes Labs platform combines an archive of processed data and the scalable computing resources in the cloud to make analyses such as these straightforward and timely. Further, the capability of merging data from multiple sources can lead to more comprehensive results than can be obtained from a single data source.
We are still a ways off from an accurate map of surface deformation, but with the proliferation of satellites and sensors, and the tools and technologies to analyze them in near real-time, we are accelerating our understanding of these phenomena and our ability to plan and respond.