Article category: Company News, Government
Hacking Food Security from Space
Does widespread hunger caused by food shortages contribute to conditions that lead to regional...
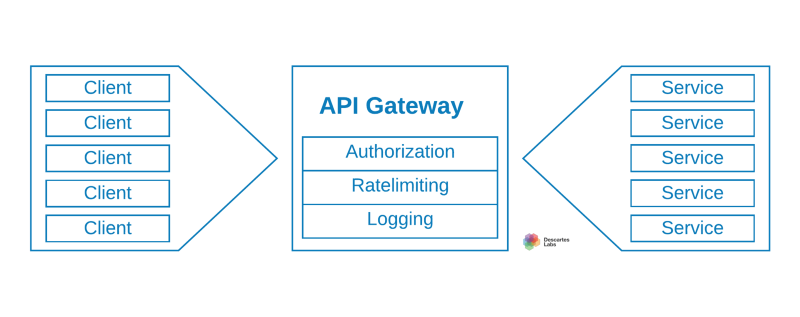
Here at Descartes Labs, we have been using the microservice architecture in building out our platform. If you are unfamiliar with microservices, they are a collection of independent services often communicating over HTTP or GRPC. Check out Martin Fowler’s 2014 article for more information.
One of the challenges in using microservices is handling the many tasks that each has in common: authentication, rate-limiting, logging, etc. Instead of implementing this within every service, a common pattern is to place a single gateway that handles these requirements and routes them to the service. This is where NGINX and Openresty, a Lua framework on top of NGINX, step in.
The key requirement of our logging, specifically usage logging, is to capture the number of bytes sent to the user since we are providing API access to our entire corpus of satellite imagery. This most closely matches our costs, such as egress, and can give us an indication of the underlying value provided to the customer.
The problem in NGINX and with chunked responses from upstream services is that getting the $bytes_sent from NGINX can only occur in the logging phase. Alternatively, the body_filter_by_lua* could be used to track the bytes from each chunk, but that is definitely a second option due to the added complexity.
The first thing to try, which DOES NOT WORK, is the following:
log_by_lua_block {
 local payload = {
 bytes = tonumber(ngx.var.bytes_sent),
 status = tonumber(ngx.var.status),
 timestamp = ngx.now()
 ... -- more values
 }
-- post payload to favorite backend for timeseries analysis
}
There are two issues with the above. The critical issue is that the Lua cosocket for nonblocking IO is not available in the logging phase. The second is we want to do this in batch.
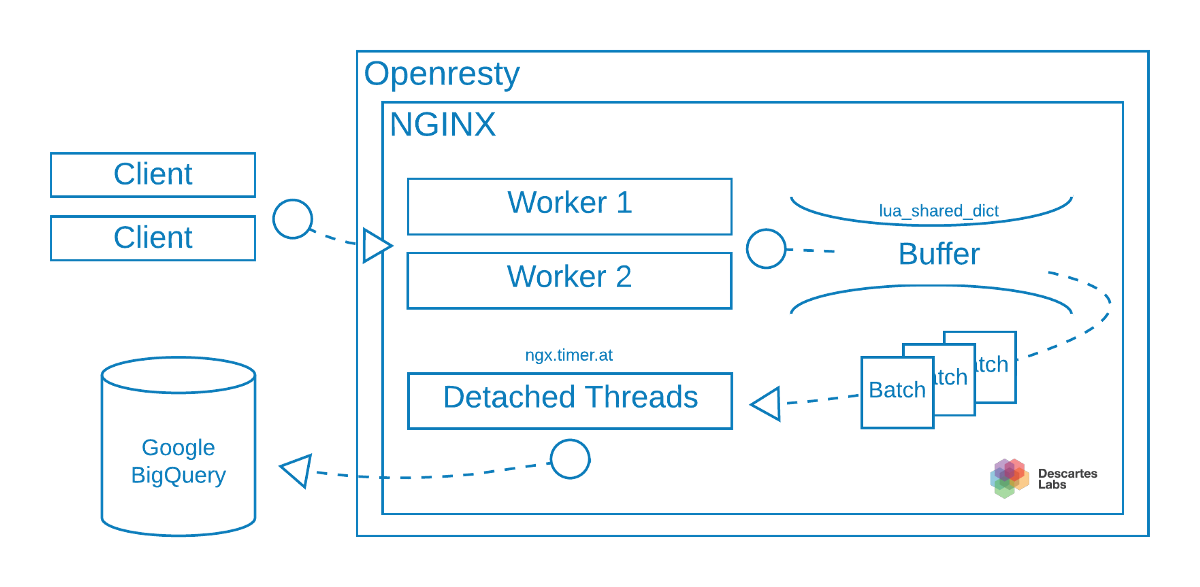
The solution we have implemented involves using a detached thread on each NGINX worker and a shared thread safe buffer.
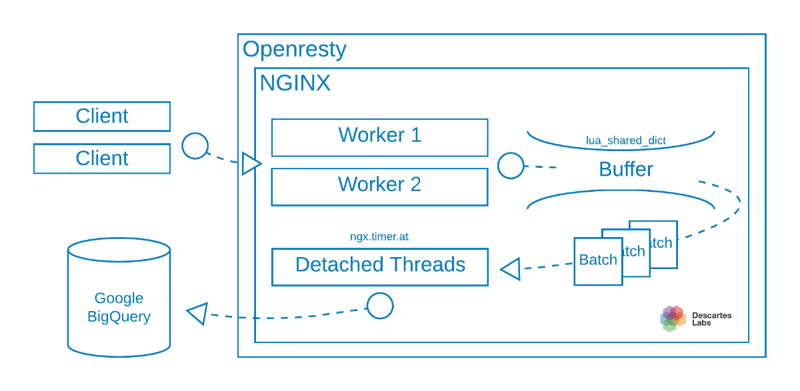
The NGINX Lua blocks look like the following.
lua_shared_dict usage_logging 10m;
init_worker_by_lua_block {
 local Logging = require "descarteslabs.logging"
 l = Logging.new()
 l:watch(ngx.shared.usage_logging)
}
location = /test {
 proxy_pass service;
log_by_lua_block {
 local payload = {
 bytes = tonumber(ngx.var.bytes_sent),
 status = tonumber(ngx.var.status),
 timestamp = ngx.now()
 ... -- more values
 }
 local Logging = require "descarteslabs.logging"
 l = Logging.save(ngx.shared.usage_logging, payload)
 }
}
The ngx.timer.at mechanism makes it trivial to watch this buffer. The only trick is that each worker will be watching the buffer, so some randomness should be added.
local check_function
check_function = function(premature)
if not premature then
 while true do
 local requests = self:get(size)
 pcall(_M.save, self, rows)
 if #rows < size then
 break
 end
 end
 local ok, err = ngx.timer.at(delay(), check_function)
if not ok then
log(ERR, "failed to create timer: ", err)
return
 end
 end
end
As a primarily Google Cloud Platform customer, we have a custom Lua client for many of the Google Cloud APIs, such as Cloud Storage, BigQuery, and Stackdriver. For this particular use case, we are trying out BigQuery. Our query looks something like this:
SELECT
 COUNT(*) as calls,
 SUM(bytes) as bytes,
 DATETIME_TRUNC(DATETIME(timestamp), `second` ) as w
FROM `project.dataset.table`
WHERE
 status=200
GROUP BY
 w
ORDER BY
 w desc
LIMIT 100
Which outputs this table:
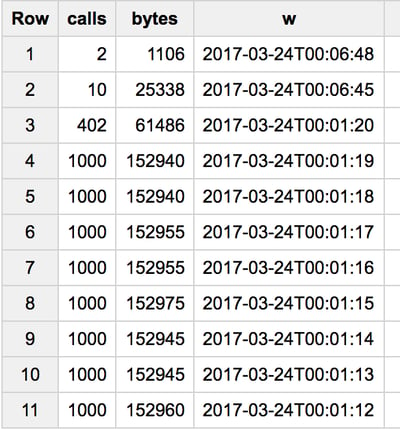
Having reached this point, it is trivial to add a few fields to group by, such as customer or service, and provide billing with varying windows and granularity.
If you wish to know more about all the bytes we are sending to our customers and our internal teams, please check out our platform or contact us at hello@descarteslabs.com.
Watch our tech blog for future posts and stay tuned for more. And if you think you might want to join our team, we’re hiring!