Article category: Mining, Science & Technology
Sentinel-1 Technical Series Part 1 | Burst Mapping: Random...
Descartes Labs fast data access mechanisms for Sentinel-1 (SAR) data enable rapid global scale...

Welcome to the first post in a technical series highlighting the capabilities at Descartes Labs (DL) for processing Sentinel-1 Synthetic Aperture Radar (SAR) imagery. SAR provides a valuable remote sensing tool, and this series will dive into detail about how we process SAR data globally and build SAR and InSAR-derived products.
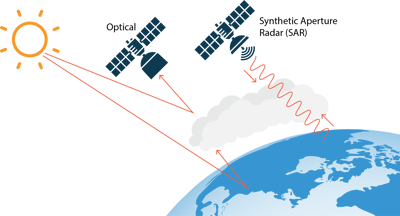
SAR is a form of radar imaging collected from a moving platform, in our case a satellite in low Earth orbit, which is able to resolve the position of an object along the satellite’s path, the distance of the object away from the satellite, and the strength of the backscatter.
Backscatter: SAR measures the radar reflectivity of objects that are illuminated by the emitted signal, and this captures the geometric orientation and material properties of objects being imaged.
Distance: SAR measures the time delay between an emitted and reflected signal to determine the distance away from the satellite.
Position: SAR measures the Doppler shift of the reflected signal, which is positive as the satellite approaches the object, zero at the point the satellite is closest to the object, and negative as the satellite moves away from the object. This establishes the position of an object along the satellite’s path.
With precise orbit data and a digital elevation model (DEM), it is possible to correlate a SAR image with geographic points on the surface of the earth.
One of the most important features of a SAR system, and arguably a disadvantage, is that it must image at a slant, typically with an incidence angle exceeding 30 degrees. Directly below the satellite multiple points will have the same distance to the satellite, and cannot be distinguished with round-trip timing information, as the timing will be the same.
In contrast, a profound advantage of SAR is that, because it actively illuminates the area of interest (AOI) with microwaves, it does not require ambient light from the sun. Further, the microwave signal is largely unaffected by weather. In sum, SAR can see at night, and can see through clouds. Indeed, a SAR image of an AOI collected on a sunny day and a SAR image of the same AOI collected from the same look angle on a dark and stormy night will look almost identical, and any differences reflect the area being imaged, not the differences in the circumstances of the collections.
There is a more subtle advantage to SAR. In addition to the widely used radar backscatter signal, each pixel of a SAR image contains the phase of the returned signal. The spatial properties of the phase changes between images allows one to infer subtle changes that cannot be seen with optical imagery. This includes slight deformations in the surface of the Earth, and changes in the scattering properties. Using the phase of SAR imagery as a signal is called Interferometric SAR (InSAR).
In 2014 the European Space Agency (ESA) launched the Sentinel-1A SAR satellite, and in 2016 ESA launched the companion Sentinel-1B satellite1. ESA intends to launch Sentinel-1C and Sentinel-1D as the need arises. The Sentinel-1 constellation images nearly all of Earth’s landmasses at a resolution of about 15m every 12 days, making it an invaluable remote sensing tool. Data are free from ESA or the Alaska Satellite Facility (ASF).
Sentinel-1 has collected roughly 7PB of data, and continues to collect data at a substantial rate. As such, making use of Sentinel-1 imagery, particularly for historical analyses, requires an effective data indexing and access strategy. Descartes Labs has developed both, which is summarized in the remainder of this section and will be described in further detail in an upcoming blog post.
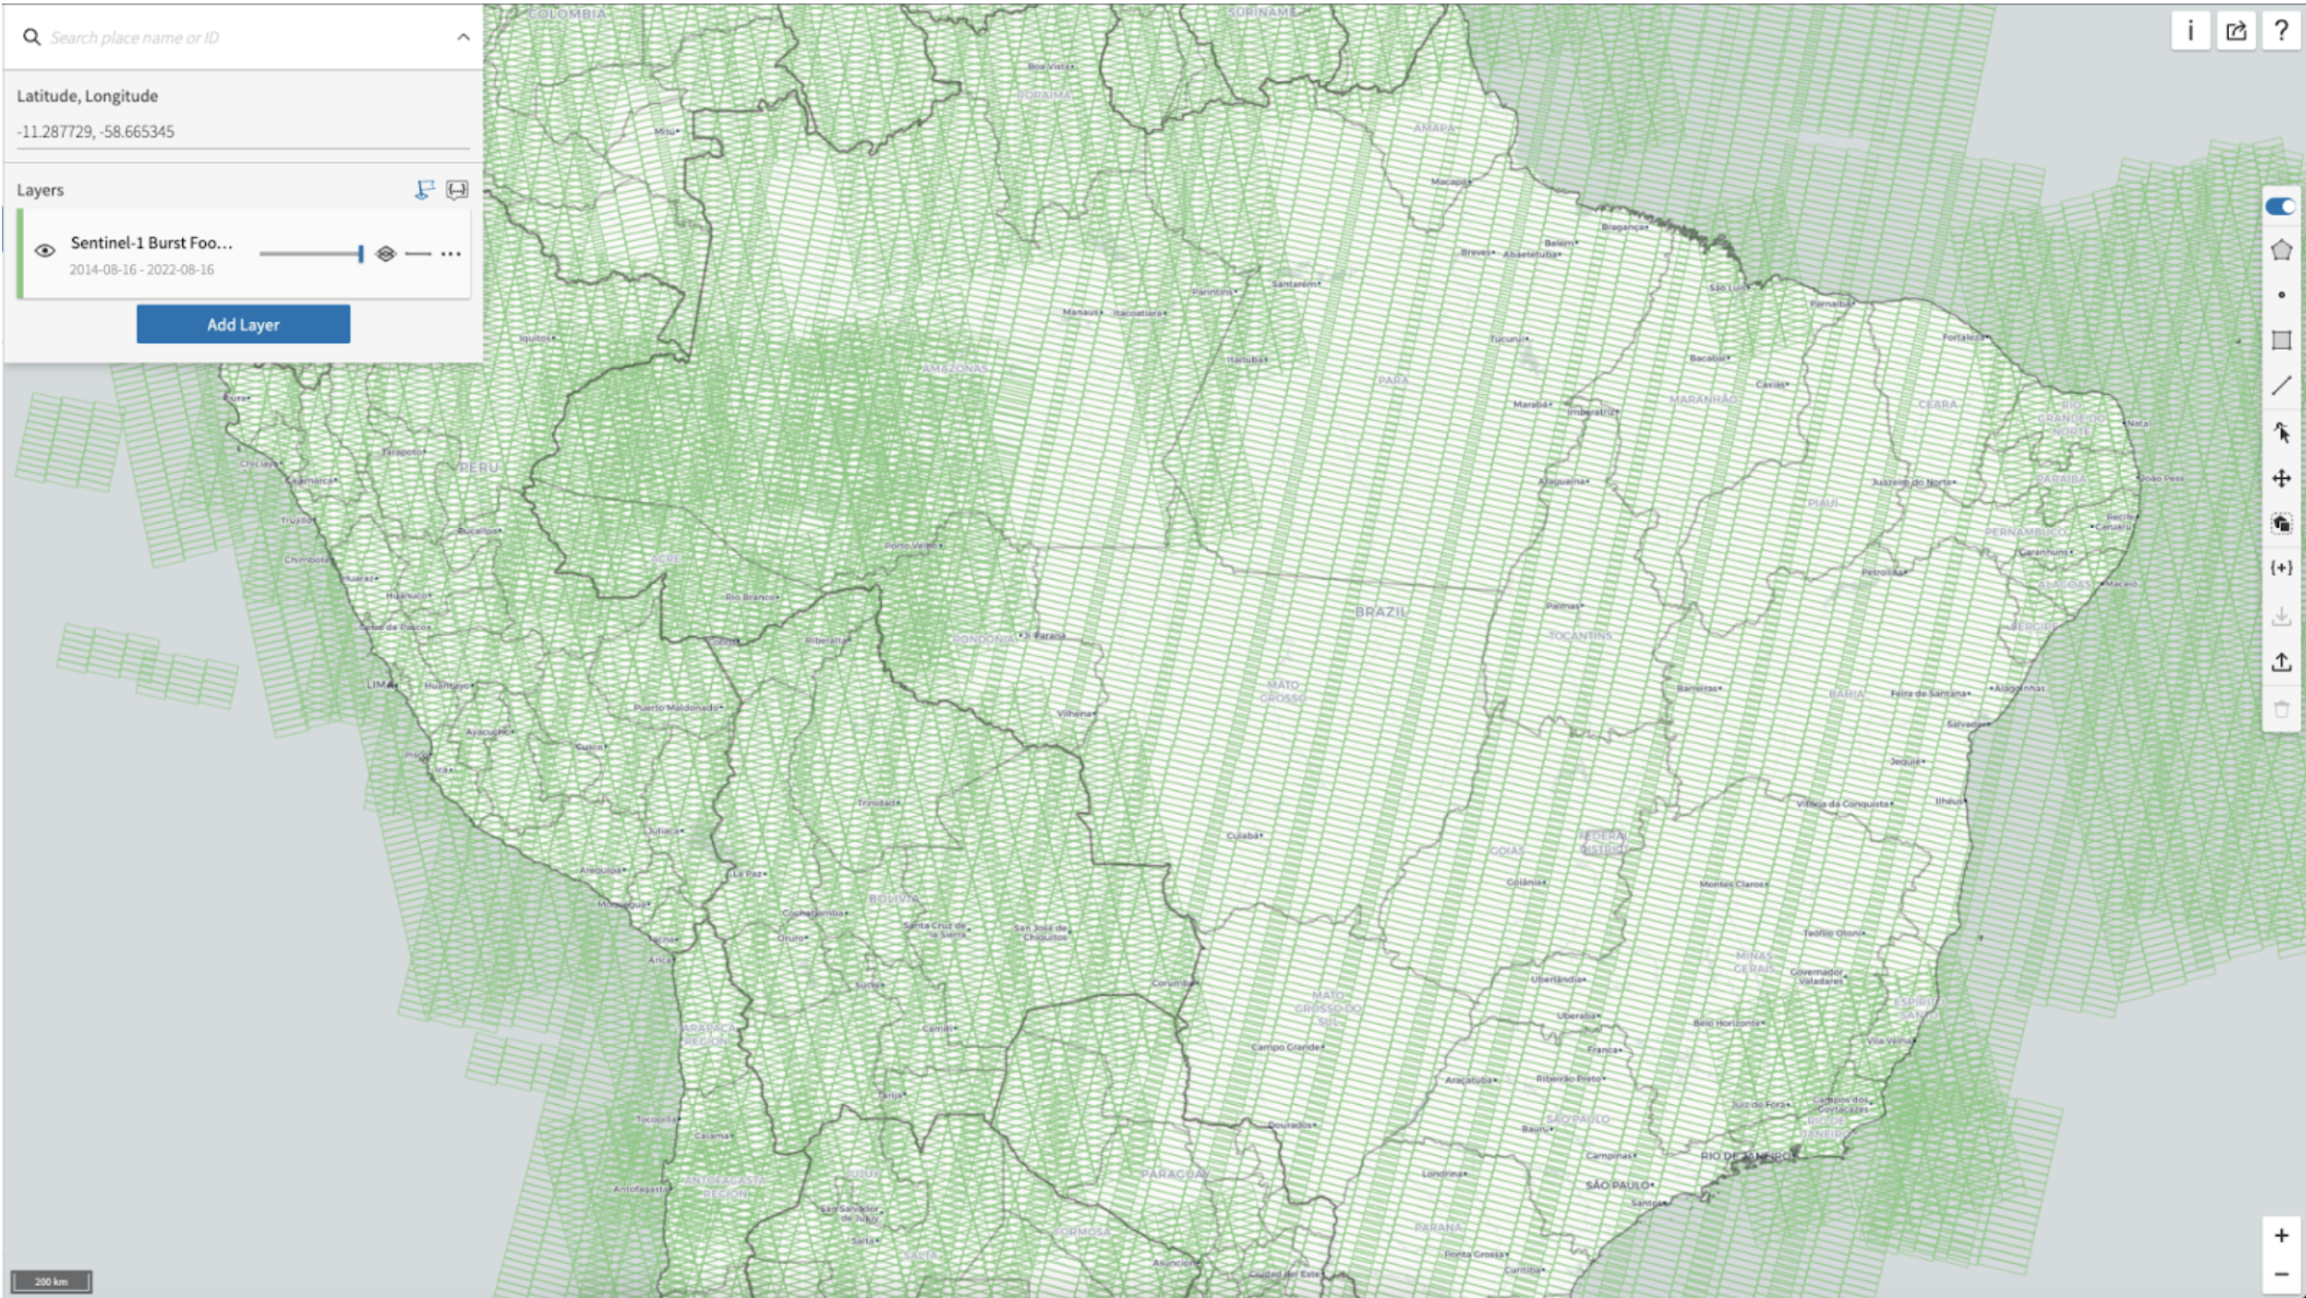
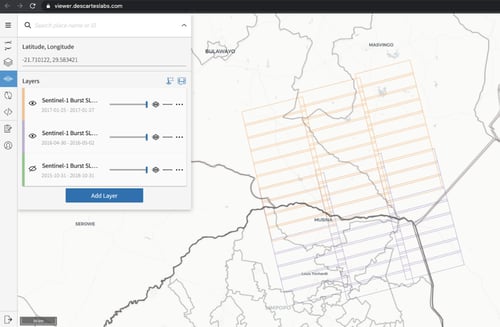
The smallest unit of Sentinel-1 imagery is a burst2. Further, ESA has tasked Sentinel-1 such that bursts are repeated consistently, making bursts the obvious choice for indexing Sentinel-1 imagery.
Descartes Labs has indexed all Sentinel-1 bursts into stacks based on orbit track, swath within the orbit track, and position (timing) along the orbit track. Given an AOI, one queries this dataset for stacks that overlap the AOI, and then selects the elements within the stack that match the desired date range. This provides a list of bursts that contain the desired data.
Accessing these bursts presents the following challenge: ESA distributes Sentinel-1 imagery in large (several GB) zip archives when the desired data are often individual bursts within the archive. At a high level, Descartes Labs' access method is to establish a nearly random access mechanism that allows us to pull complex data for an entire burst from ASF into a local array in, on average, seven seconds.
Sentinel-1 imagery, and SAR imagery in general, is delivered in a coordinate system defined by the orbit of the satellite during the collection. This makes it hard for widely used GIS tools or geospatial data frameworks to work with SAR data. Descartes Labs has opted to use UTM as the reference coordinate system for processing all Sentinel-1 imagery. This approach, often referred to as geocoding, is computationally efficient and offers a distinct advantage3 over traditional approaches.
SAR applications can be roughly split into those that use only the amplitude of the reflected signal, and those that use the phase, the latter being InSAR applications. The processing paths for these two classes of SAR applications are often quite different, particularly in regards to where along the path the results are mapped onto a geographic coordinate system. This can lead to differences in the georeferencing between InSAR results and amplitude-based results. This problem is absent when geocoding, as all processing paths begin with SAR imagery that has been mapped to a common UTM coordinate system.
Our geocoding pipeline can remap a Sentinel-1 burst from its original range-Doppler to UTM in about 100 CPU seconds.
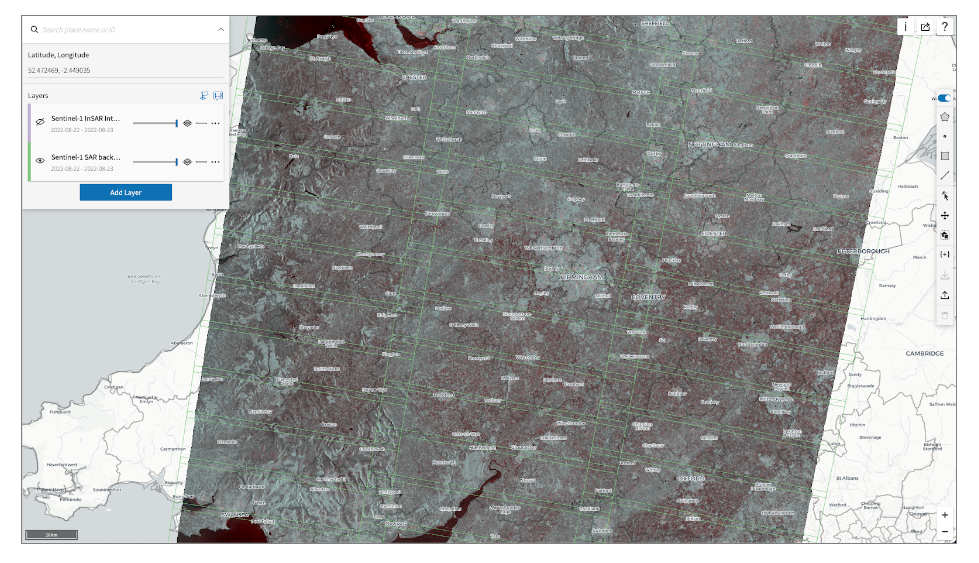
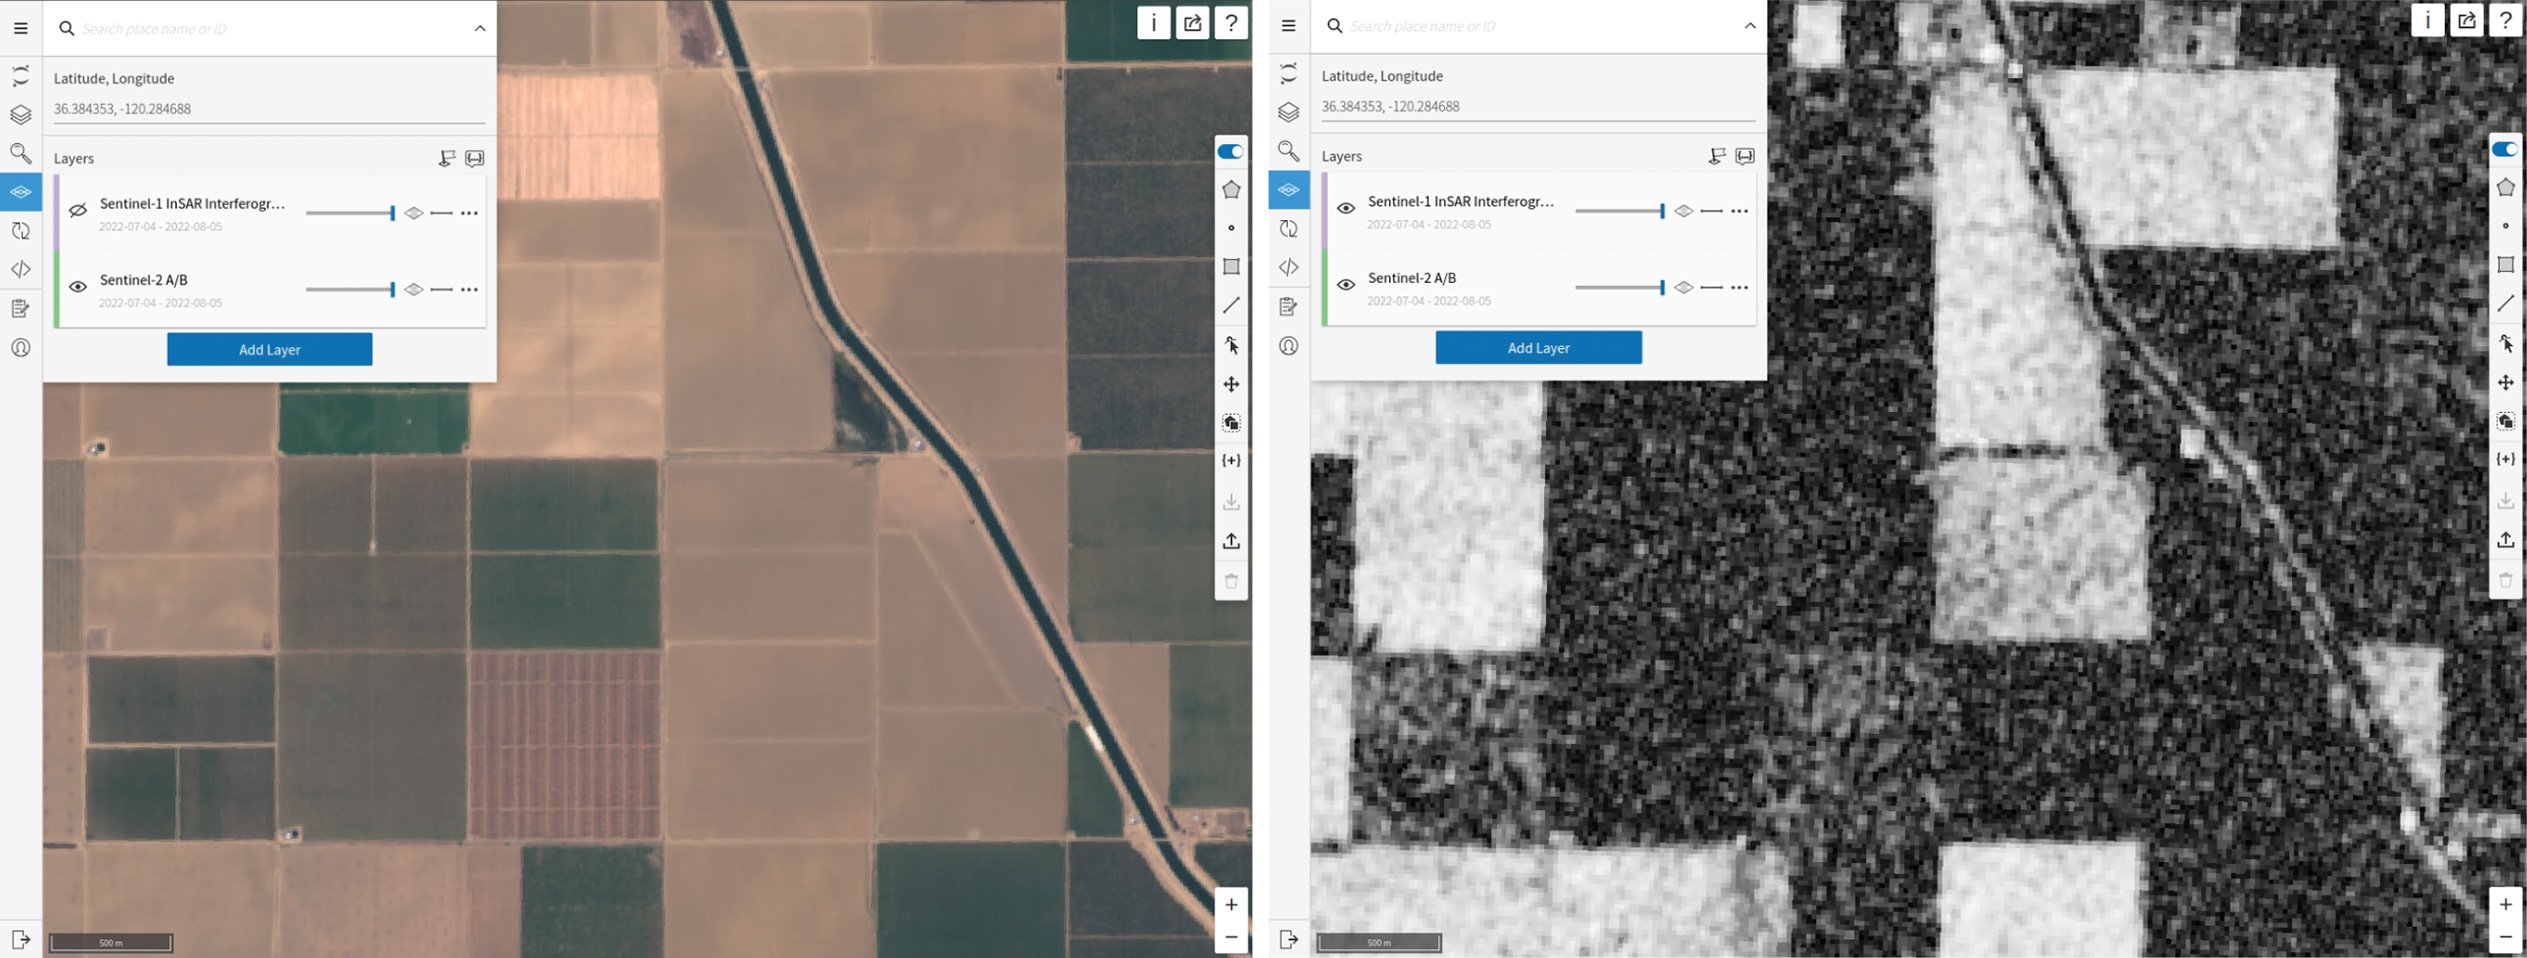
There are two global Sentinel-1 SAR products available at Descartes Labs, both are derived from the geocoded complex SAR data. The first is our our amplitude or backscatter product4. In addition Descartes Labs provides a radiometric terrain correction layer that helps ameliorate the effect of local terrain slope on pixel brightness.
The second product is our global InSAR layer. InSAR is derived from the change in phase between two SAR collections. The phase difference between two SAR scenes is called an interferogram and contains two layers or bands. The first is the phase difference itself. The second, called coherence, is a measure of how reliable the phase difference is.
Descartes Labs has computed the interferograms for all pairs of compatible Sentinel-1 images collected within 24 days or less of each other.
This archive of interferometric data is exceptionally valuable for a number of applications.
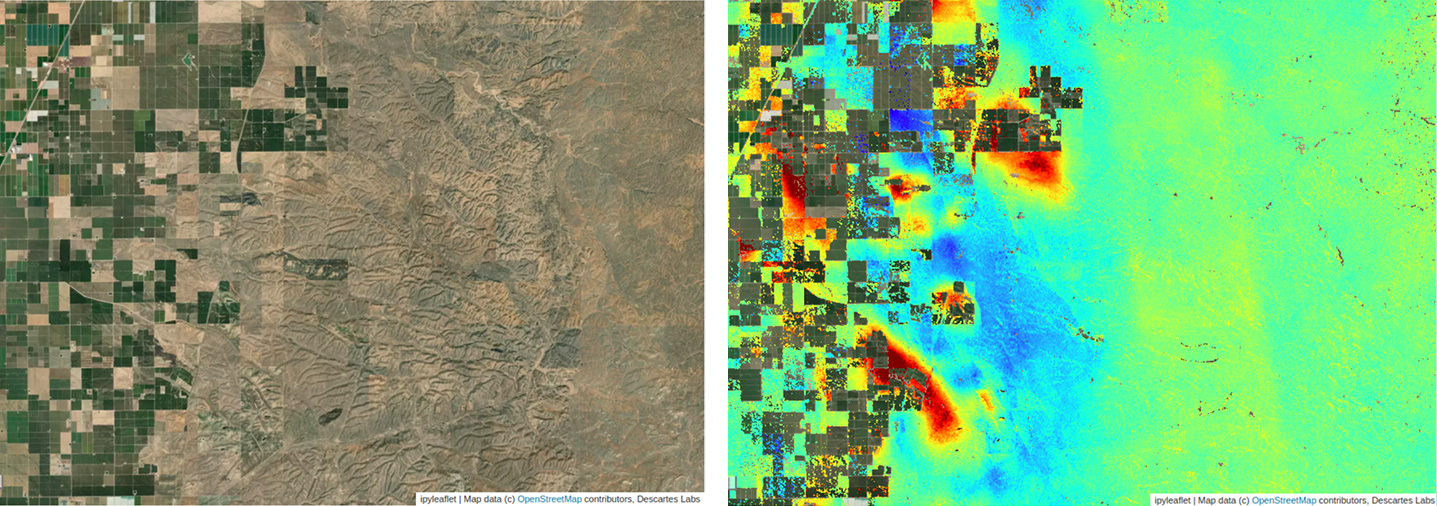
Descartes Labs global InSAR layer enables a number of derived products. The global coherence data can provide an effective change detection map for many areas5.
More significantly one can build a global map of surface motion. This ongoing effort will be described in more detail later on in this series. This layer will provide trends in surface deformation with a yearly cadence.
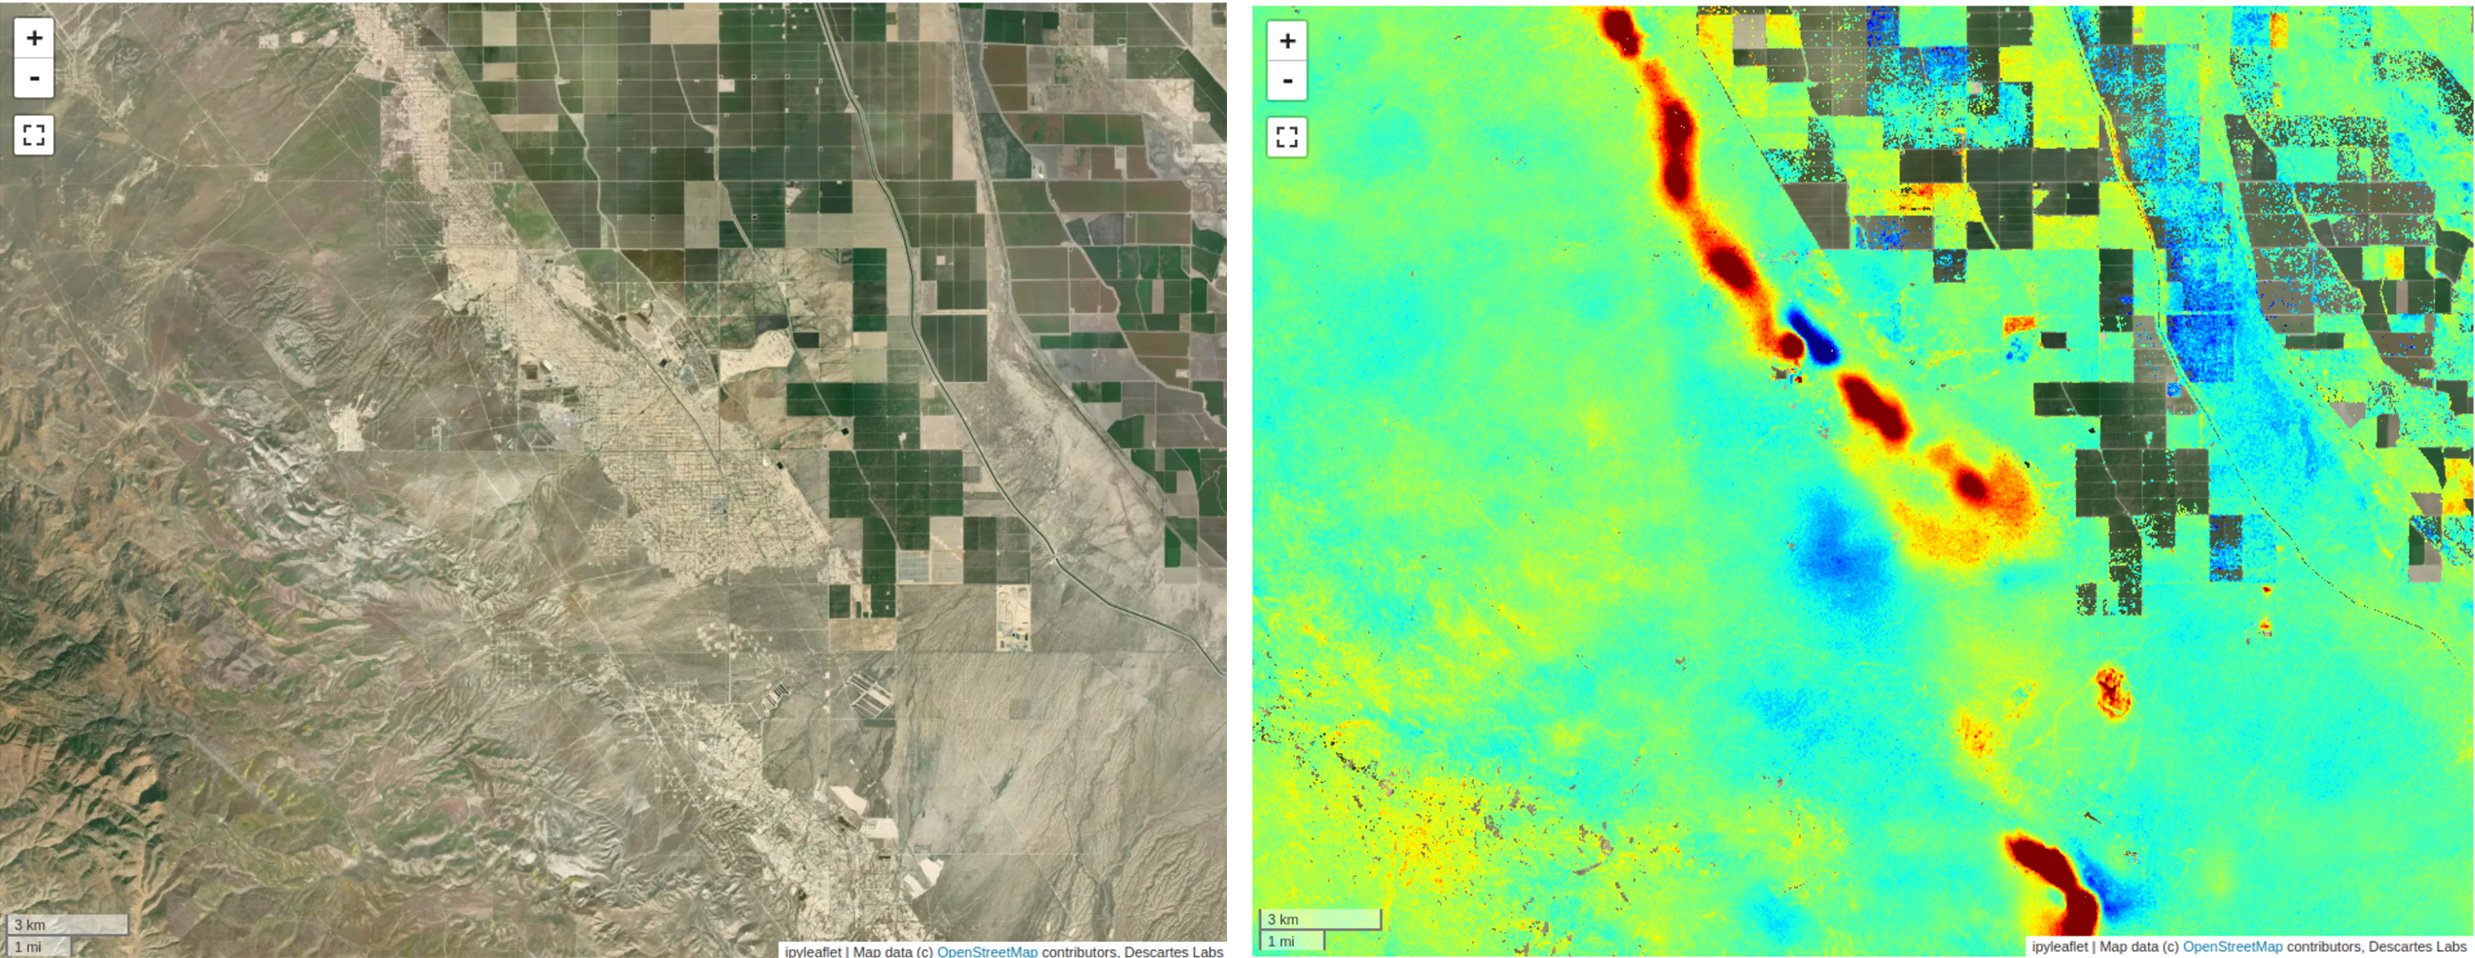
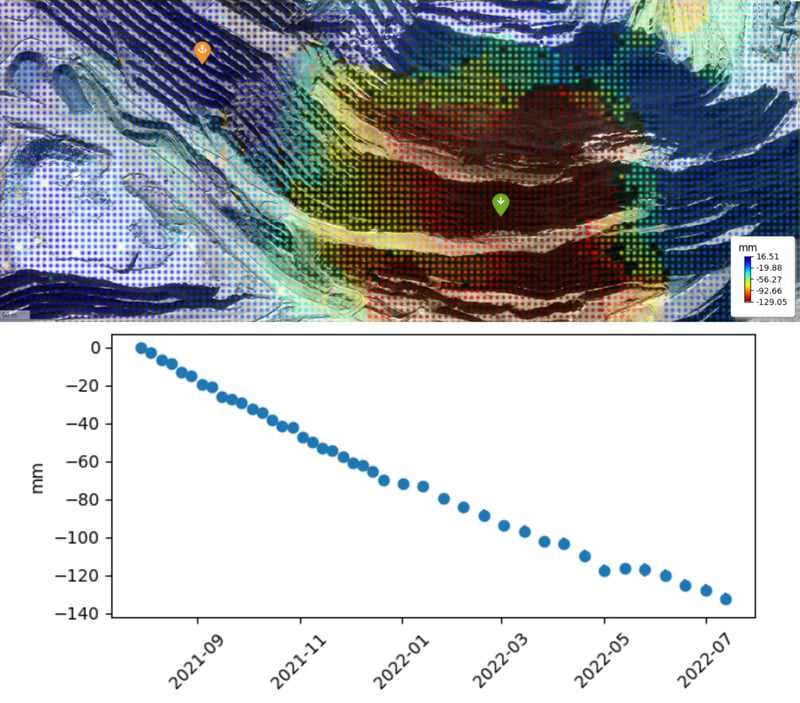
Descartes Labs offers a time-resolved on-demand deformation monitoring product, which is only available in settings favorable to InSAR.
However, when available, this automated analysis pipeline can provide timely, valuable information regarding municipal subsidence, infrastructure health, and mining operations.
Sentinel-1 SAR provides an effective remote sensing tool that supports a wide range of measurements. Working with Sentinel-1 at scale provides some significant challenges. Descartes Labs can help address those challenges at any level, from accessing raw data, to building low level products, to delivering high level analyses.
If you're interested in how Sentinel-1 data can benefit your business, get in touch with our team to learn more.
Check out the next post in this series, "Sentinel-1 burst mapping: Random seeks into PB scale non cloud-optimized data archives", where we take a look at indexing and accessing S1 data.

1 In December 2021, Sentinel-1B failed. As of August 2022, ESA has declared it lost.
2 We are referring to the interferometric wide swath terrain observation through progressive scans (IW-TOPS) imaging mode. Nearly all Sentinel-1 imagery is collected in this mode.
3 This approach requires a more nuanced implementation of enhanced spectral diversity.
4 This includes all available polarizations, typically VV and VH.
5 Vegetation and water have a baseline coherence that is too low to be useful as a change detection tool.
Reference:
Agram PS, Warren MS, Calef MT, Arko SA. An Efficient Global Scale Sentinel-1 Radar Backscatter and Interferometric Processing System. Remote Sensing. 2022; 14(15):3524. https://doi.org/10.3390/rs14153524