Article category: Company News
Descartes Labs Platform Now in Closed Beta with Los Alamos...
Starting today, Descartes Labs is accepting applications for Beta access to the most advanced...
Understanding the different types of data used in geospatial modeling is essential for those learning about this industry and a good refresher for those who have already mastered it. This is part two of our educational series. Read part one here: A Look into the Fundamentals of Remote Sensing.
Let's begin by defining raster data, one of the primary ways to store spatial data. The raster data model represents data over a grid of evenly spaced rows and columns of cells, with a data value assigned to each cell, or pixel. Digital images, including aerial and satellite imagery, are stored using this data model. Read more about Descartes Labs raster applications here. Rasters are well-suited to represent both continuous and discrete phenomena.
Common file formats: GeoTIFF, JPG/JPEG, netCDF
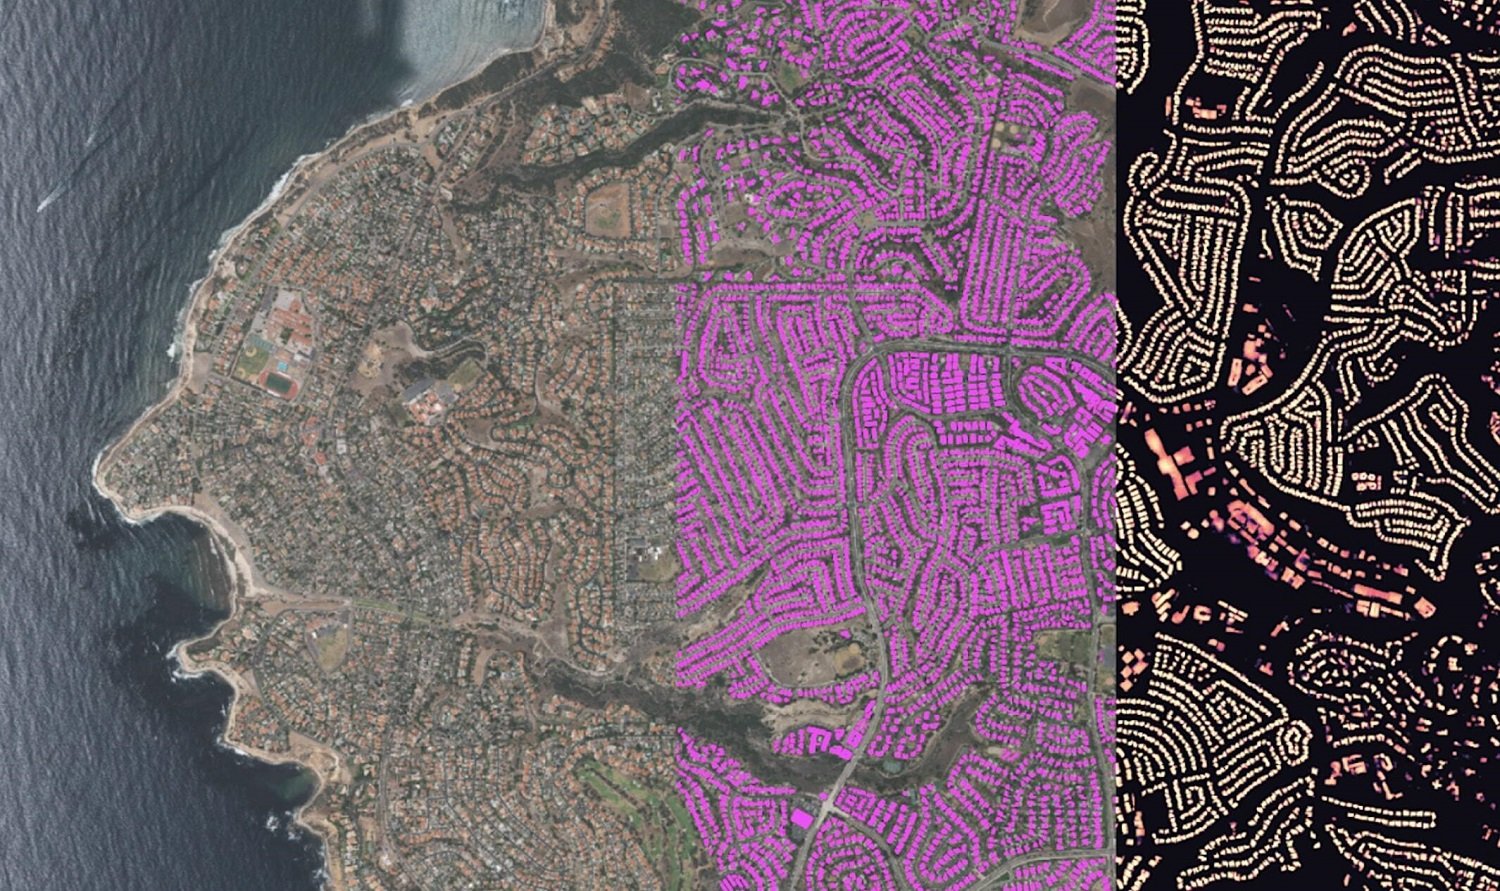
What is discrete data? Each cell, or pixel, of discrete data is assigned a value corresponding to a category, such as land cover (forest, water, urban, etc.) or wildfire risk (high, medium, low). Discrete data can also be referred to as thematic or categorical data.
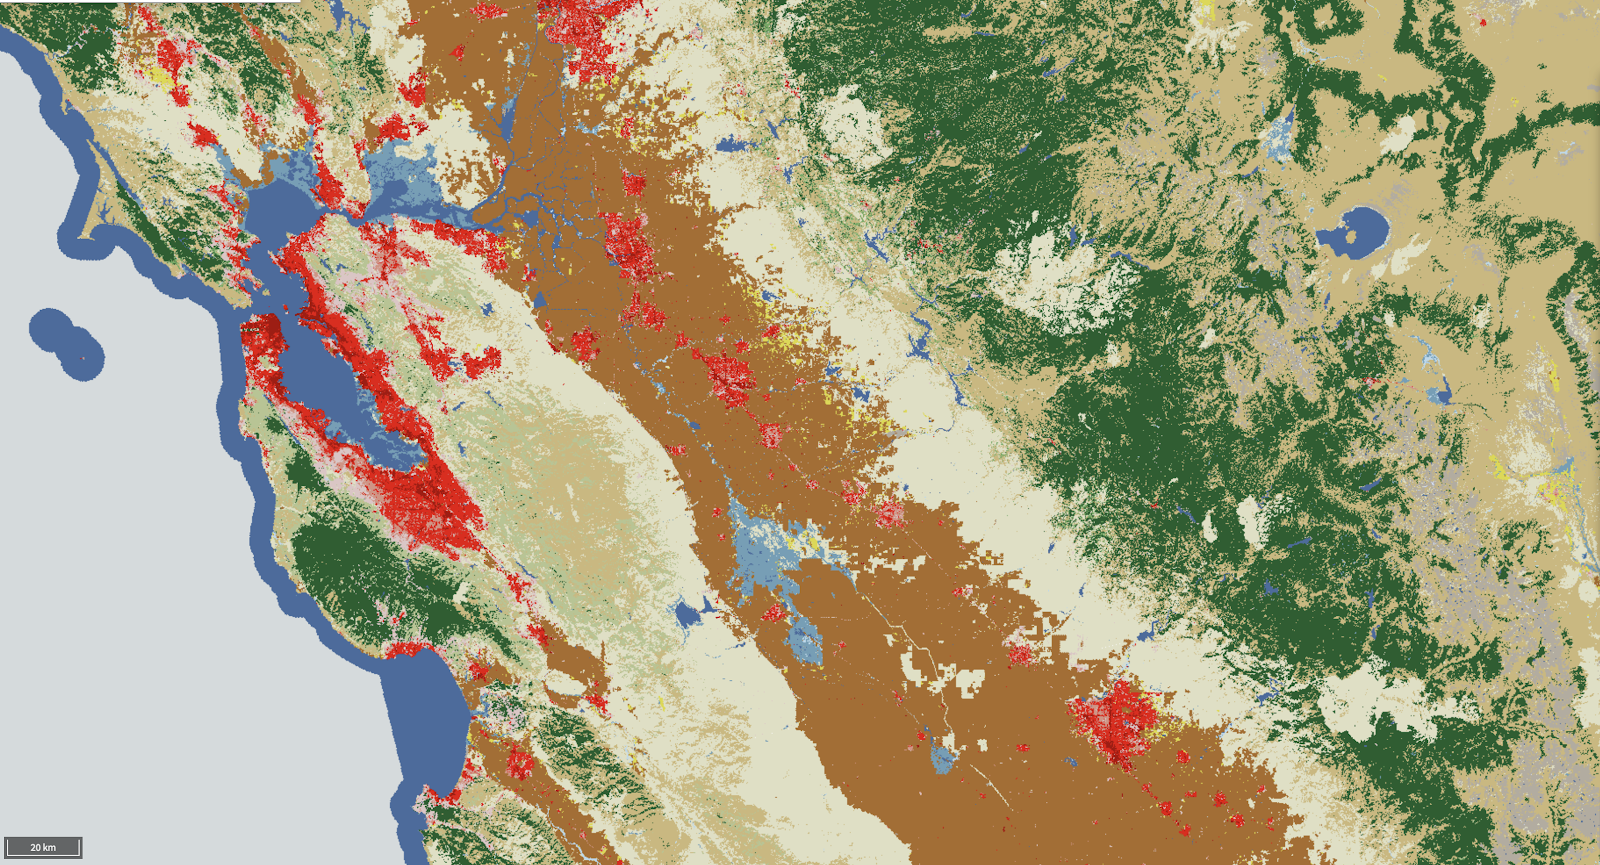
The National Landcover Classification Database (NLCD) displays categorical information, such as “urban” or “agriculture”, and is an example of discrete data.
What is continuous data? Continuous data represents the measured or modeled value of the variable over each cell. Examples of continuous variables are spectral reflectance, elevation, atmospheric carbon dioxide, and surface temperature.
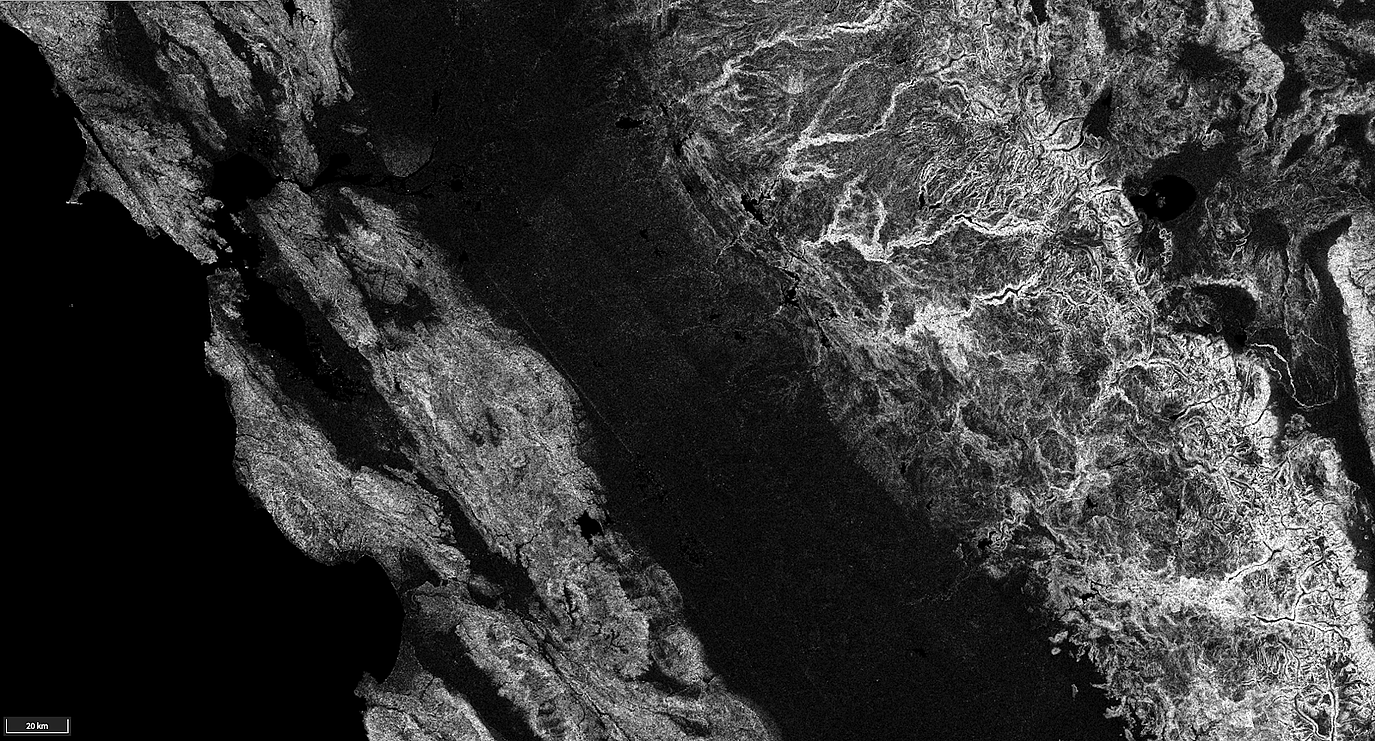
The Shuttle Radar Topology Mission (SRTM) product (top) contains slope data expressed in degrees, and is an example of continuous data.
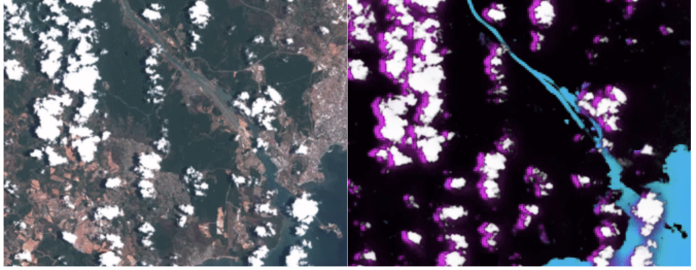
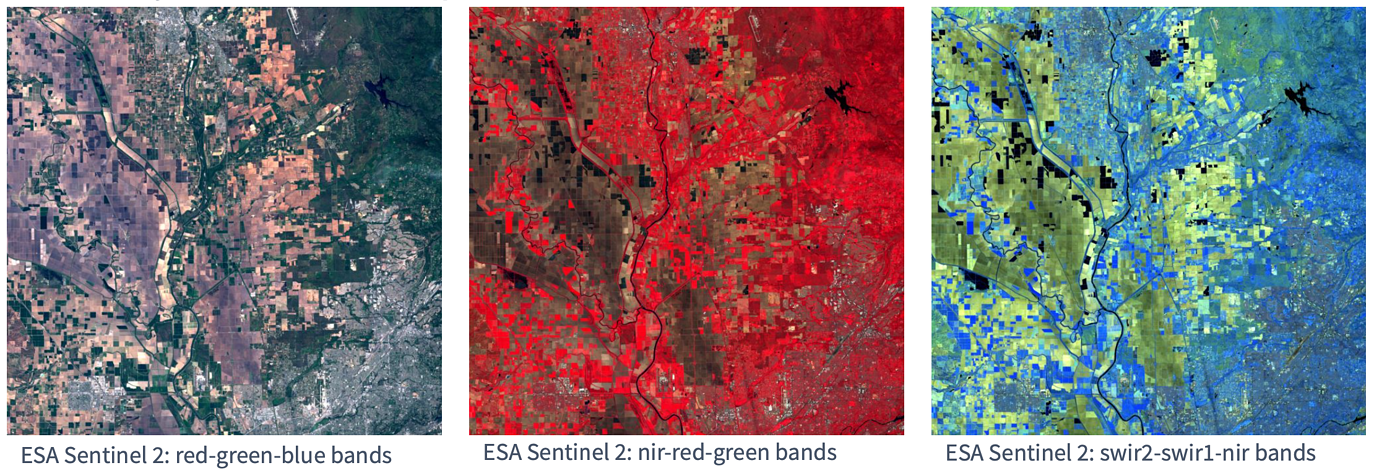
The most common type of continuous data you’ll encounter on the Descartes Labs Platform are spectral reflectance values in aerial or satellite images, which provide information on the reflected and emitted electromagnetic radiation at each pixel location on the ground. Red, green, and blue pixel values come from the visible range of the electromagnetic (EM) spectrum, and are used to create true-color images that most closely match what we see with our eyes.
A true-color image is shown in the left-most image of the figure below. We can create false-color images by visualizing portions of the EM spectrum outside of the visible range, but displayed in the red, green, and blue bands. By displaying information in this way, we get a sense for what the satellite is able to sense outside of the visible spectrum. For example, to make vegetation pop out in imagery, it is common to display the near infrared, green, and red reflectance values in red, green, and blue bands, respectively. Due to high near-infrared reflectance from vegetation, this false-color combination will show vegetation in red, as shown in the middle image of the figure below.
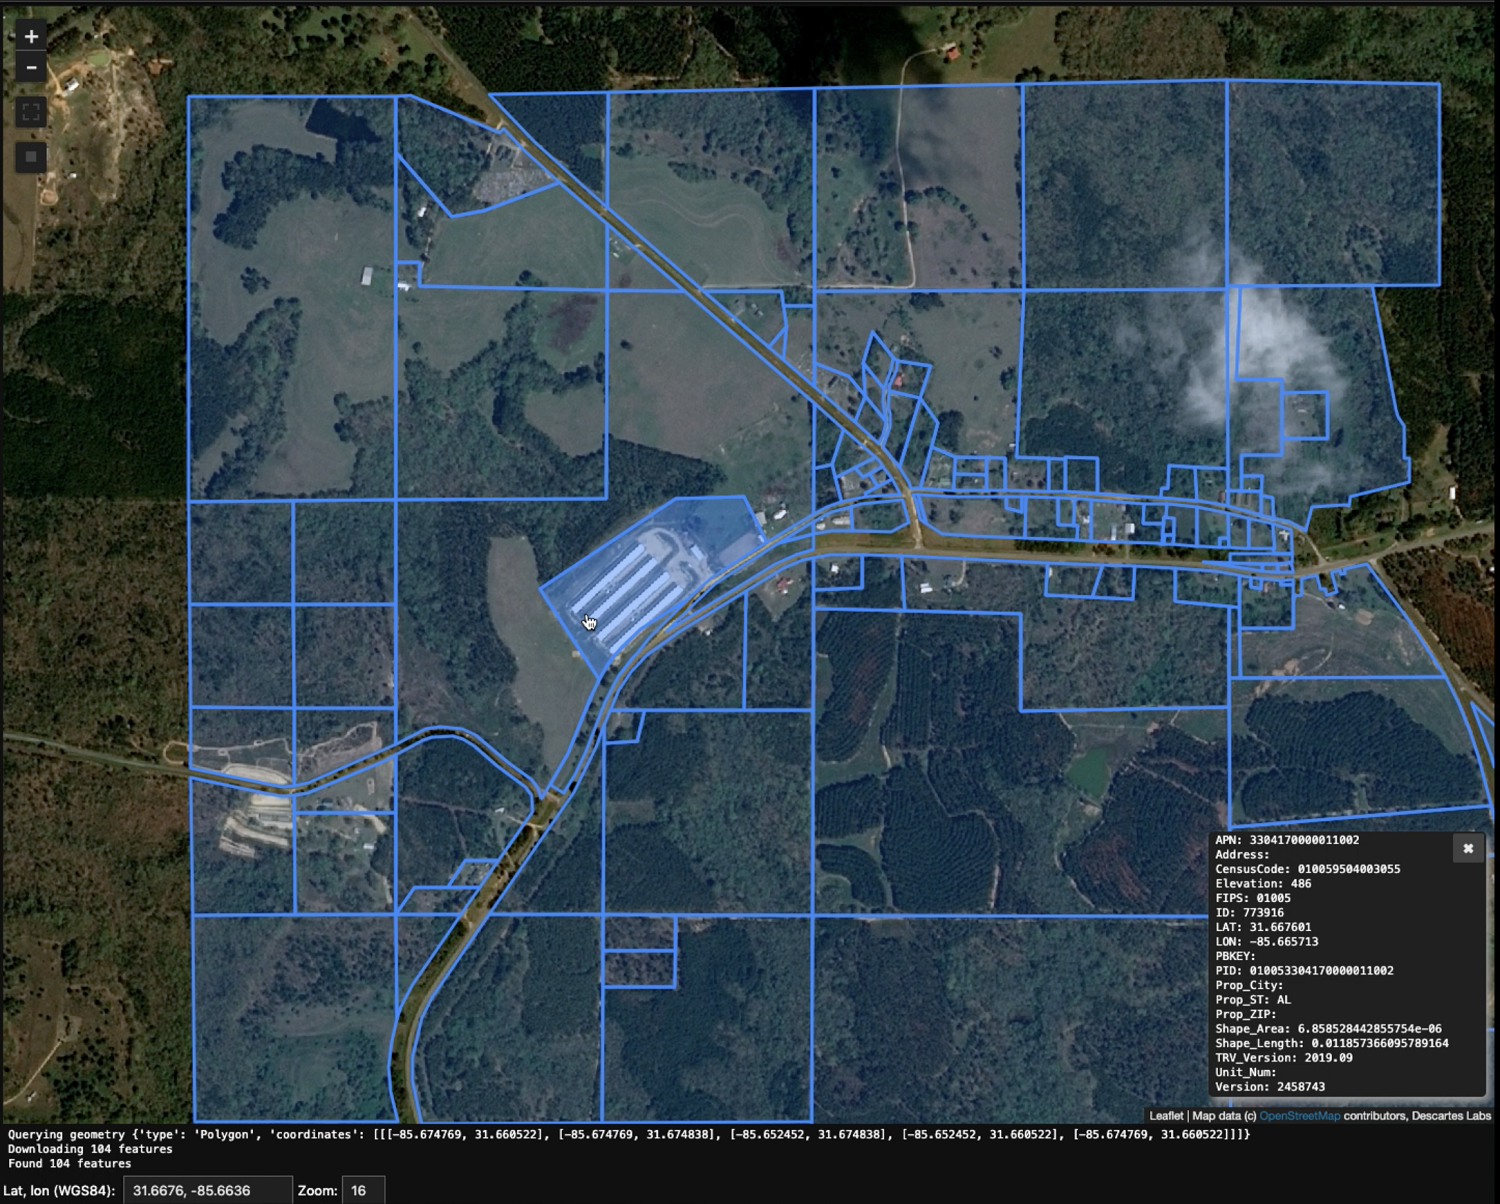
The other type of spatial data is vector data. The vector data model is used to represent features using points, lines, and polygons. Data is stored using x, y coordinates that define the vertices of the features, such as locations of dams (points), roads (line), or political borders (polygon). Vector data models have discrete boundaries.
Common file formats: Shapefile, GeoJSON, KML
A coordinate system is a method to define the unique position on a plane or in space of geometric elements using combinations of numbers called coordinates. Simply put, a coordinate system is a method for identifying the location of a point on the earth. There are two types of Earth coordinate systems: geographic and projected.
Fun Fact! Our company is named after René Descartes, the inventor of the cartesian coordinate system in the 17th century. This coordinate system was the first link between geometry and algebra, and the foundation for projected coordinate systems.
What are geographic coordinate systems? Geographic coordinates are perhaps the most familiar way of representing coordinates on the Earth’s surface. In these coordinate systems, a location is represented by its latitude (north-south position) and longitude (east-west position). Latitude and longitude are defined using an ellipsoidal representation of the Earth. Because the coordinates are defined on a curved surface, the physical distance covered by one degree of longitude will vary from north to south (due to convergence at the poles), as will latitude from east to west (due to the ellipsoid shape). Placing coordinates on a flat surface requires a map projection, described in the next section.
What are map projections and projected coordinate systems? For many practical purposes, we need to project coordinates onto a 2D plane. A projected coordinate system is defined on a flat, two-dimensional surface. Projected coordinate systems describe locations in linear units (such as meters or feet).
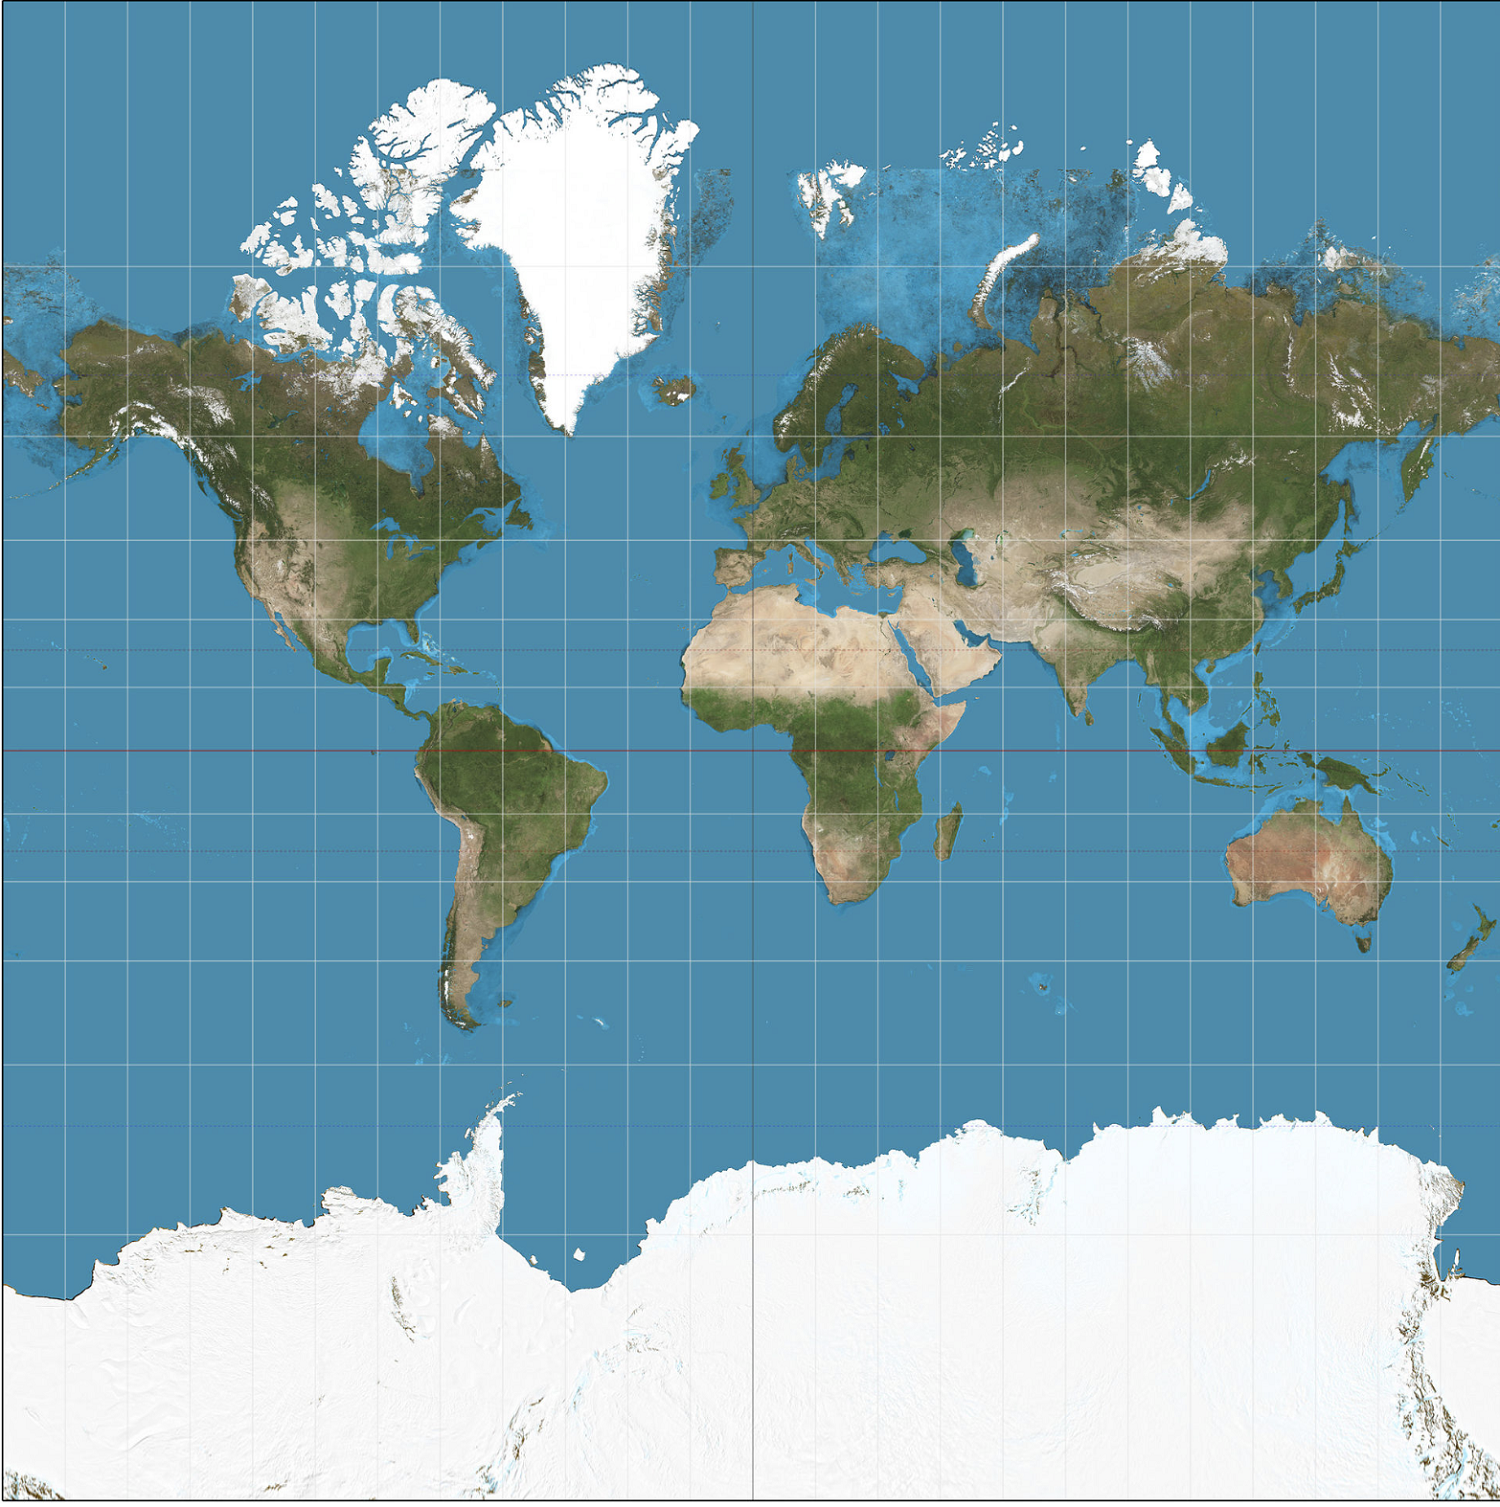
Since map projections are abstractions of a 3D Earth onto a 2D plane, distortions are inevitable. These distortions differ for each map projection but are well known and studied. Distortions that can occur with a flat map include those related to: shape, area, distance, and direction.
While it is impossible to maintain all the native spatial elements of your geometries once projected, you can prioritize the most important element for your map's purpose. Projections often use descriptive names like “conformal”, “equidistant”, “equal-area”, and “azimuthal” to describe the properties that they preserve. A projection can accurately preserve one property (either shape, area, distance or direction) but not others. For this reason, it’s important to choose a projection that preserves the properties that are relevant to your application. For example, the Mercator projection is used for navigation because it preserves the angle between any two curves (conformal projection).
We hope you enjoyed this refresher on spatial data and coordinate systems. Feel free to bookmark and share this article to help educate others in some key fundamental areas of geospatial science. Learn about the fundamentals of remote sensing in our other educational blog.
Visit our website to learn about how Descartes Labs solve business problems faster and drive operational advantage with the automated analysis of geospatial data.