Article category: Science & Technology, Climate Solutions
Fighting Wildfires Using a Cloud-based Supercomputer
In the wake of yet another season of significant wildfire activity across the US and in particular...
Over the past week, we’ve watched in horror as wildfires tore across Northern California. With a deep data archive of satellite imagery and expertise in remote sensing, we also wondered what we could do to better understand the extent of the damage.
Digging through news stories and coverage of the fires, it’s difficult to find information on the full extent of the burn scar. Additionally, there is little information on the types of land cover that have been most affected. We used Sentinel-2 data from the European Space Agency and land cover classification data from the USDA to try to fill in some of these gaps, with a focus on the particularly large and damaging fires continuing to burn in Sonoma and Napa counties.
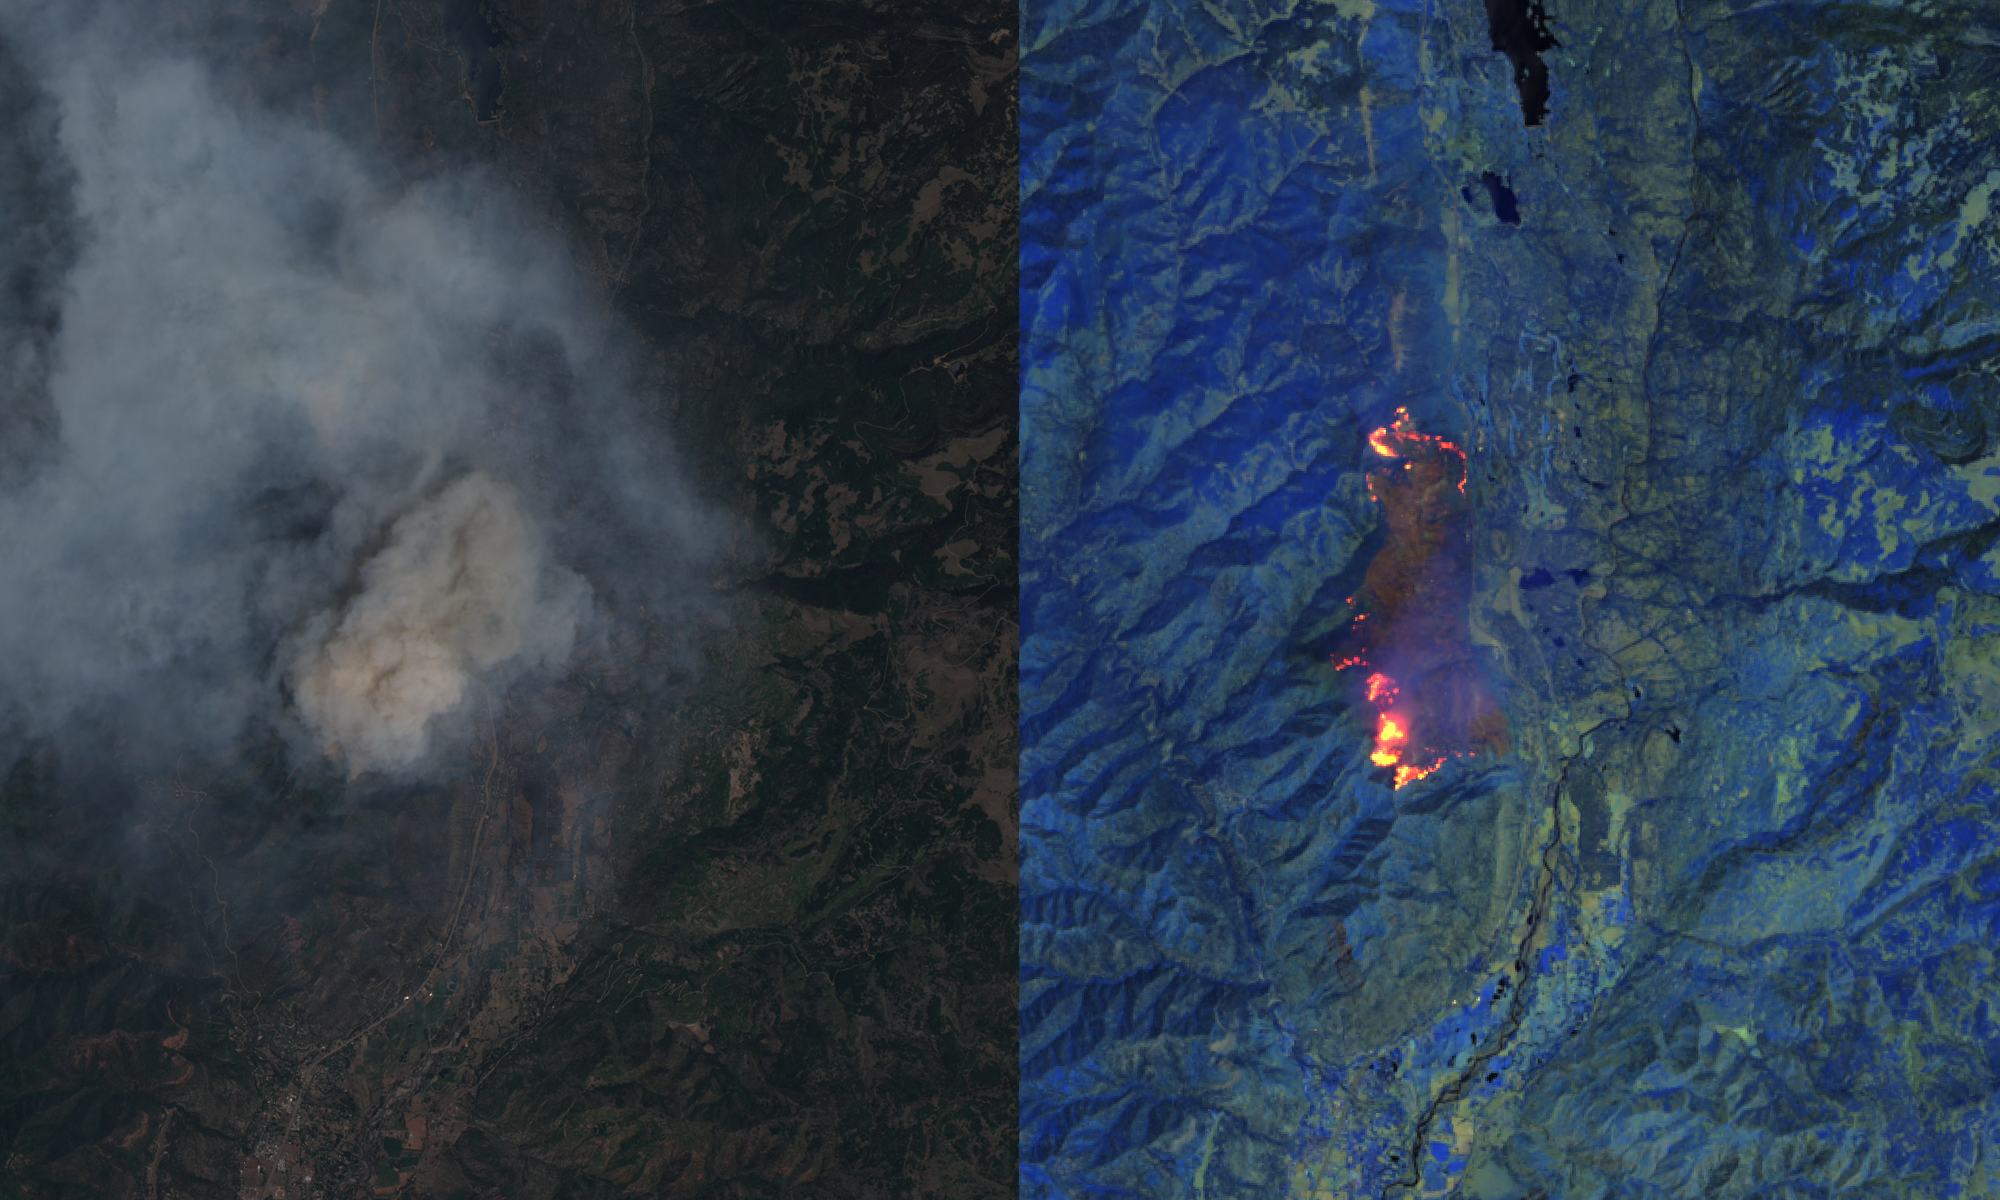
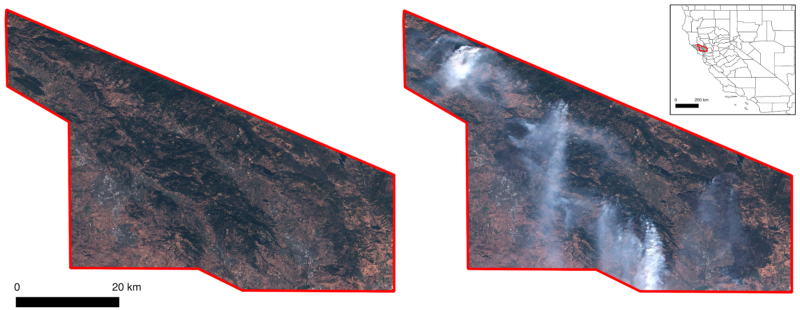
A straightforward way to visualize where fires are burning is to look for smoke plumes. Here, we can use optical Sentinel-2 data to compare imagery acquired before (October 6) and after (October 12) the fires began:
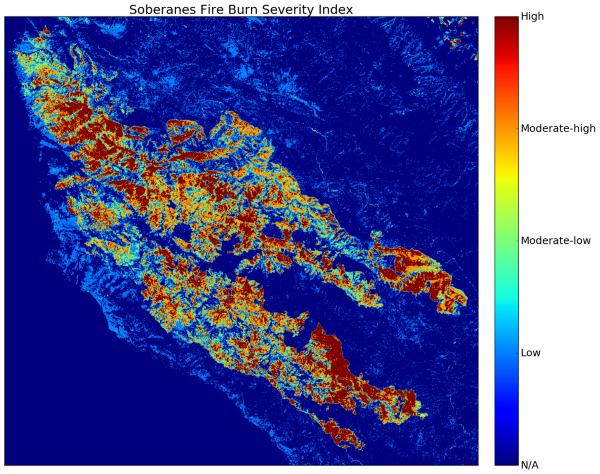
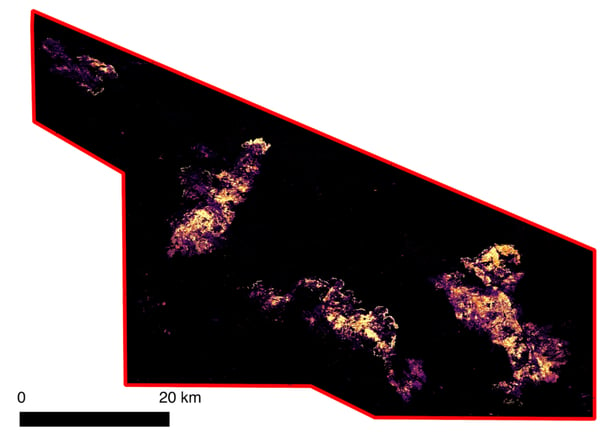
Visually, we’re used to associating smoke with fires. But the non-visual information collected by satellites can be even more telling. The differenced normalized burn ratio (dNBR) utilizes information from the near infrared and shortwave infrared bands to illustrate the severity of the burn, and most importantly, can provide information through the smoke. On October 12, the dNBR produced imagery that shows intense burning (in yellow) throughout much of this region:
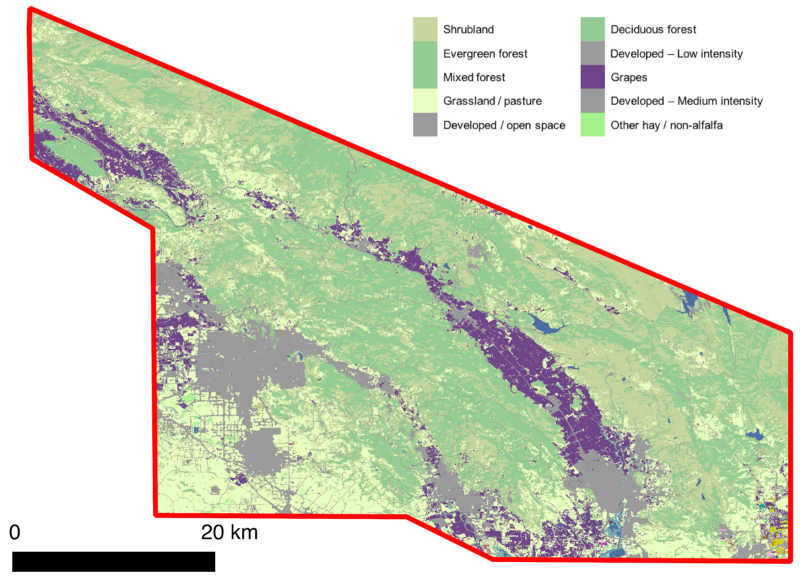
To add context to this information, we can compare the areas affected by the wildfires to land cover types previously classified by the USDA. Each year, the USDA classifies over 100 crops and other land cover types (such as water bodies, forest, and developed areas) using supervised classification methods applied to Landsat imagery, called the cropland data layer (CDL). Below, the CDL map illustrates that the region affected by the fires is mostly rural (green areas) with developed areas, including the largest city in the county, Santa Rosa, appearing in gray:
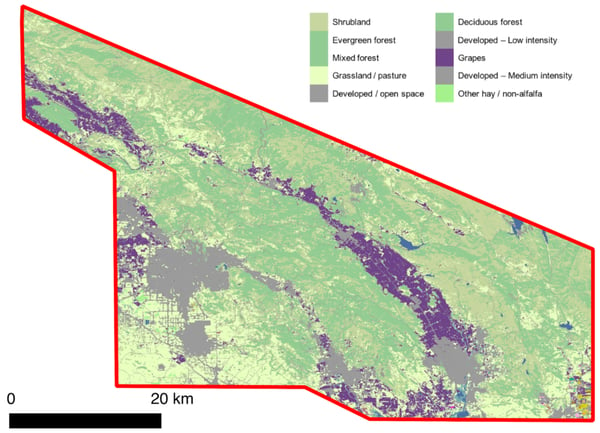
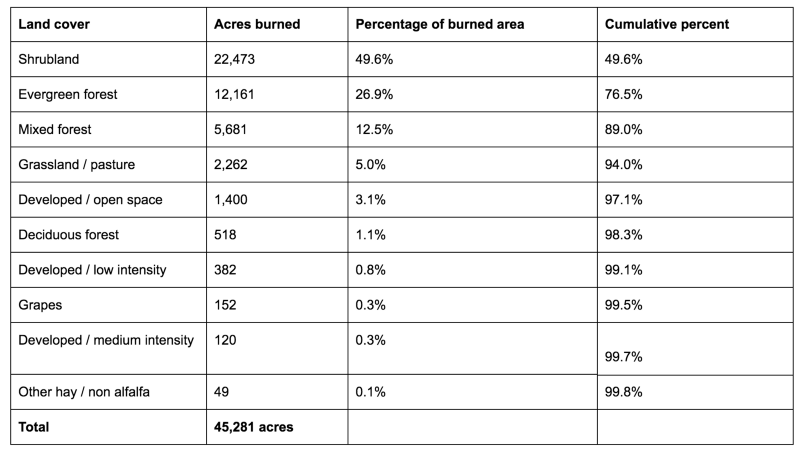
If we intersect the USDA classification with our burned area map, we get a better understanding of what types of of land cover were most affected by the wildfires:
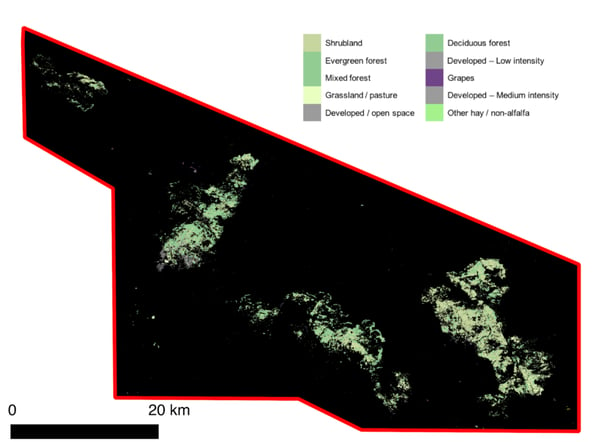
Based on this analysis, we estimate that over 96,000 acres were burned in this region. Of that area, over 45,000 acres experienced severe burning, defined as where the dNBR is greater than 0.27. Almost 50% of the severely burned acres were shrubland, and amazingly, only 4.2% of the total burn came from developed areas. However, with such a large area experiencing severe burning, 4.2% of that covers an extremely large residential area of nearly 2,000 acres:
Notably, we can’t yet validate these statistics since there isn’t ground-truth data for burn severity of ongoing wildfires. It very well could be that we are actually underestimating the burn scar extent and severity since the smoke could be interfering with the dNBR signal. However, analyses like this underscore the extent and magnitude of the damage caused by these fires. Mapping where the fires caused the greatest destruction can help with everything from ecosystem restoration to rebuilding efforts, and provide much-needed information to government officials, insurance companies, and residents. By leveraging satellite imagery, these maps can be updated regularly and readily distributed to those who need them most.
Satellite imaging technology is continually improving. We are at an incredible point in history where government datasets are freely available, commercial datasets are evolving, and we have the computing capacity to process all of these datasets. At Descartes Labs, we believe that the combination of these tools will revolutionize natural disaster response and relief efforts. Because of that, we are developing an initiative to generate, validate, and disseminate datasets to aid first responders and government agencies address the impacts of natural disasters like the recent wildfires and hurricanes that have had such devastating impacts.
To do this, we are building relationships with organizations and individuals who can provide us with up-to-date ground-truth information, enabling us to build valid, accurate datasets and products to map the effects of natural disasters. We are working locally with groups near our headquarters in New Mexico and also thinking broadly about recovery efforts from Saint John to Santa Rosa. It’s an exciting time to be a Cartesian, and we are proud to use our resources to help where we can.
Want to help us in these efforts? If you are a first responder and want to share information with us and get on our initiative email list, feel free to reach out at disaster-response@descarteslabs.com, or if you want to join our team, we’re hiring: descarteslabs.com/jobs