Article category: Climate Solutions
Putting our Wildfire Detector to Work in New Mexico
In 2018, approximately 360,500 acres burned across our headquarters’ state of New Mexico. After a...
In the wake of yet another season of significant wildfire activity across the US and in particular California, our drought-weary states brace for the start of a new wildfire season that will once more put lives and property in danger. With price tags per fire ranging between tens and hundreds of millions of dollars, hundreds of lost structures, and invaluable loss of life, wildfires are a daily risk during the windy season in our western and southwestern states and seen as a mysterious, ungovernable force of nature by those not accustomed to them.
The analysis below is a demonstration of automated wildfire monitoring and burn scar assessment using the Descartes Labs Platform, which provides easy access to remotely sensed imagery, a key technology to help keep us all safe as the climate changes and the risks of catastrophic wildfires continues to grow. Our result is based on a revolution in sensor technology that is creating an explosion in data volume and data rate that can be used to understand and combat this problem, not only in California but around the globe. To tackle previously intractable compute or data intensive problems requires reliably ingesting and processing the massive amount of data in near real-time—which takes a supercomputer in the cloud.
Why use our Platform? Well, because relevant imagery is available with a few keystrokes for the past few decades. Anywhere in the world. With 10 terabytes (TB) of near real-time data coming in per day, roughly the equivalent of 5,000 hours of standard video, the data set is only growing larger by the minute. Using the full MODIS, Landsat, Sentinel 1, 2, and 3 imagery archives, the Descartes Labs Platform provides us with a view of the planet that no one has ever seen before—not only is it multi-sensor, multi-resolution and multispectral—it’s also a multi-decadal historical lens.
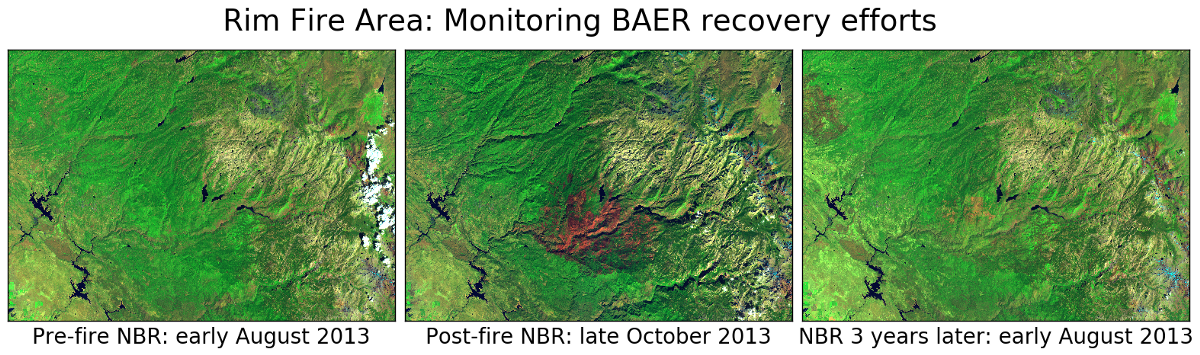
The benefits of using satellite data are significant especially for post-fire assessments by Burned Area Emergency Response (BAER) teams and the US Forest Service, as it enables automatic and continual monitoring of a specified fire perimeter. An example of this is shown above, where we look at California’s Rim Fire of summer 2013 that is still the largest wildfire on record in the Sierra Nevada mountain range. Compared to the fresh fire scar (center image), many of the areas that had experienced low and moderate burn severity seem to be much recovered three years later (right image), and the high-severity burn areas are improving still (orange pixels in the center of the 2016 image).
I lived through my first wildfire evacuation during New Mexico’s Las Conchas fire of 2011 and will never forget the strange light, the red sun, and the falling ashes in the driveway. I still recall the incessant hourly checking of the Incident Information System website hoping for an updated fire perimeter map that would NOT include my home. Thankfully, there was no loss of life associated with that wildfire, although the extent of damage to Native American watersheds at the time was extensive. And the damage only compounded over the next few years as flash floods and mudslides ravaged the hydrophobic, burned slopes of the canyons.
While many wildfires start accidentally from lightning or downed trees in a storm hitting a power line, they can also originate from a dropped match, cigarette embers, campfires, exhaust sparks from a train, or arson. Temperature, humidity, and wind all influence wildfires. Strong winds can push embers far outside the fire perimeter; while many will burn up completely before landing, larger embers can travel for thousands of feet and cause fire spotting or new blowups. The large, intense fires can create their own weather system, increasing their flow of oxygen and preventing low-pressure systems with needed precipitation and low temperatures from moving in. A really large fire can generate hurricane-force winds, up to 120 mph, which up close would sound like a freight train rushing directly after the fire fighters.
The first responders will usually name the fire after the closest meadow, creek, type of plant, or camping site they see when arriving at the scene. The incident command team responsible for the fire may use a combination of aerial nighttime flights over the fire, perimeter and fire line patrols, and manual or on-the-ground assessment of impacts. After the fire is contained, a Burned Area Emergency Response (BAER) team and the US Forest Service will perform a burn severity assessment and plan for area recovery actions. So far little of this laborious effort involves satellite imagery and is instead heavily reliant on ground work. So with that in mind, a question I asked myself (as I know others have) is why not use remotely sensed imagery (i.e., acquired from a safe distance) to monitor not only the burn scar while the wildfire is active, but also characterize the degree of burn severity in areas that might be very difficult to access by foot? Turns out the US Forest Service has some nifty Landsat methods prototyped, but they are limited in their usage primarily by a lack of fast access to analysis-ready, current satellite imagery.
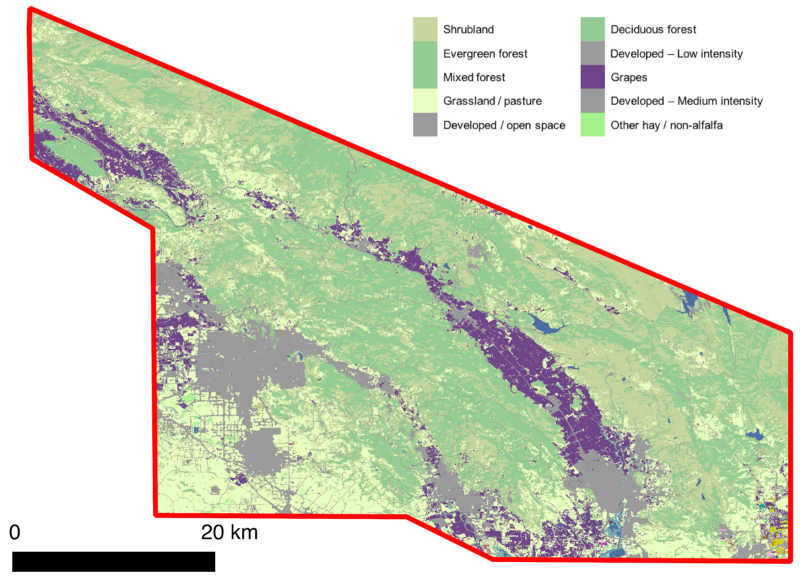
Multispectral satellite data contain a wealth of information about our Earth. Each type of land cover has a different spectral signature across the electromagnetic spectrum that is dictated by intrinsic material composition and molecular structure. Satellites typically measure several spectral bands outside of the range of light visible to the human eye, many of which are sensitive to qualities like water content, vegetation structure, and mineral composition.
When multiple bands are combined for visualization or in mathematical algorithms, information about certain features can be enhanced, isolated, and analyzed. An example is using two spectral bands to derive normalized difference indices, such as the generally known NDVI used for studying vegetation. For this analysis we need an index that can tease out burn area signatures. The Normalized Burn Ratio (NBR) index was first introduced in 2005 and consists of the normalized difference between the near-infrared (NIR) and the short-wave infrared (SWIR) band, and as such requires a sensor collecting those spectral bands (e.g., NASA/USGS Landsat, European Space Agency Sentinel-2, or commercial DigitalGlobe WorldView-3). The NIR band reacts positively to leaf area and plant productivity, while the SWIR band responds to drying and some non-vegetated surface characteristics and is absorbed over green vegetation and moist surfaces. For a given area, NBR is calculated from an image just prior to the burn and a second NBR is calculated for an image immediately following the burn. Burn extent and severity can then be judged by taking the difference (DNBR) between these pre- and post-fire indices and using the range interpretation provided, for example, by the USGS FireMon program. During the next growing season, DNBR data sets are calculated again as part of the extended assessment of burn area recovery.
Problem: The NPS-USGS Burn Severity Mapping Project provides users only a limited set of data for storage reasons, and with a certain degree of latency, which limits useful analysis to post fire extended assessments. Not to mention for any active fire the assigned remote sensing analyst has to go through the process of downloading each necessary scene and doing all the imagery pre-processing and analysis by hand.
With our scalable and agile multi-sensor satellite data platform, one can:
Let’s take a quick look at the Soberanes fire in Monterey County, California.The fire started south of Carmel Highlands on July 22, 2016 from an illegal campfire in Garrapata State Park. No one imagined that it would be burning for two and a half months, or that it would become the costliest fire in U.S. history, with 68 structures lost, over a thousand firefighting personnel, and suppression cost around $236 million according to the National Interagency Fire Center. This price tag by far exceeded the 2002 Biscuit Fire cost of $165 million, even considering the usual inflation adjustments. It was contained only in late October 2016, with pockets within the fire perimeter smoldering through December.
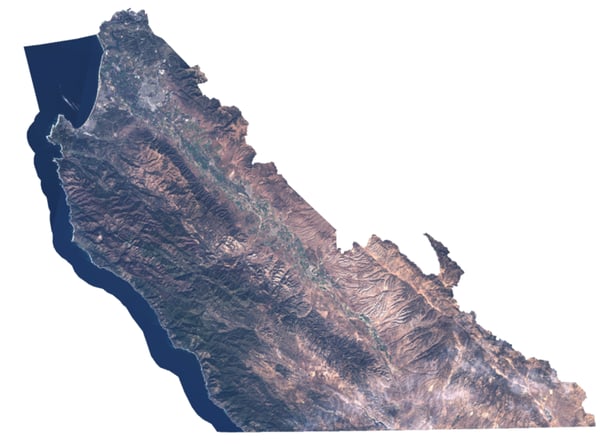
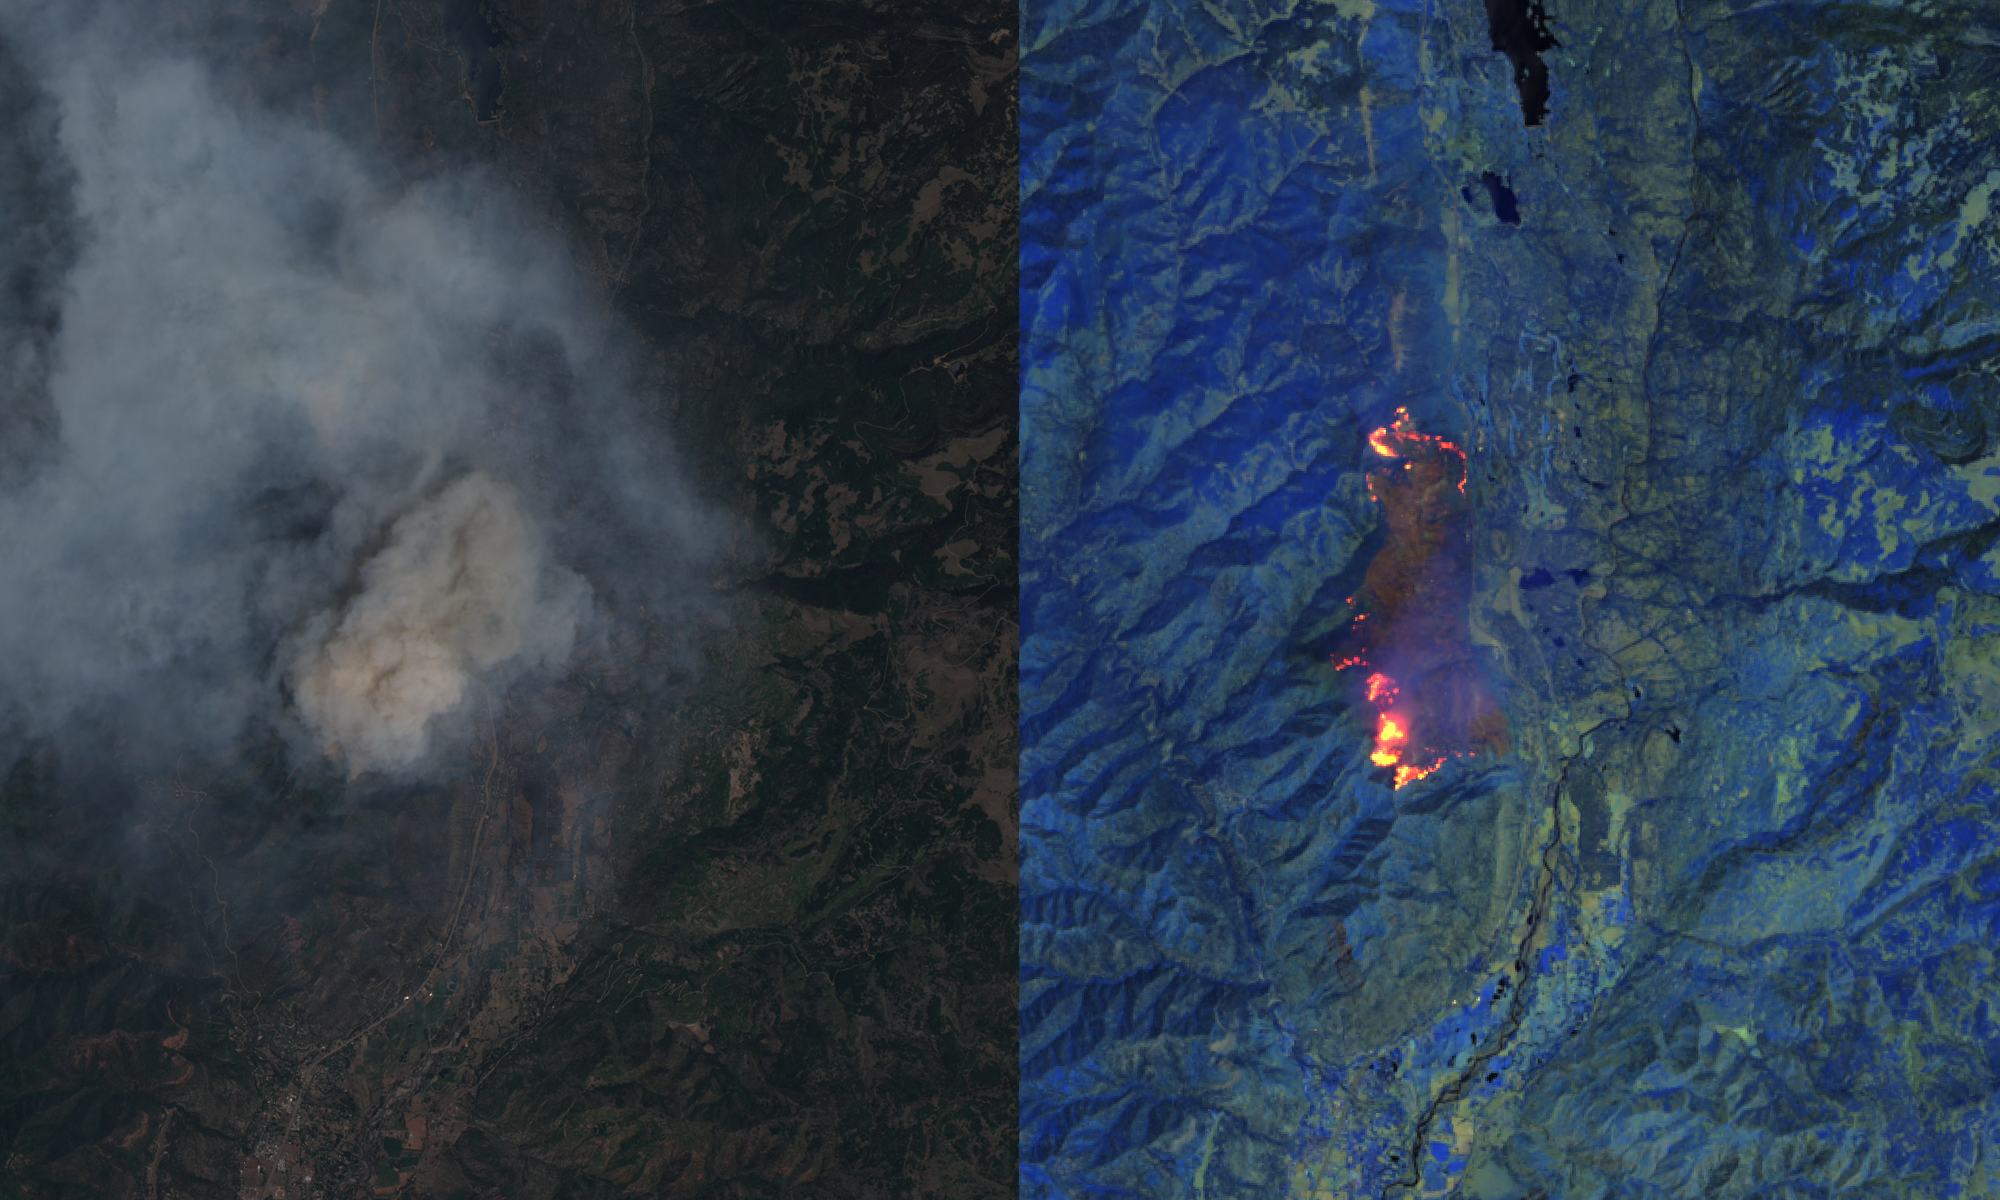
It is difficult to discern the fire scar in RGB image above, so let’s help our perception by looking at the same area in false color, specifically using short-wave infrared/near-infrared/deep blue mapped to the RGB channels.
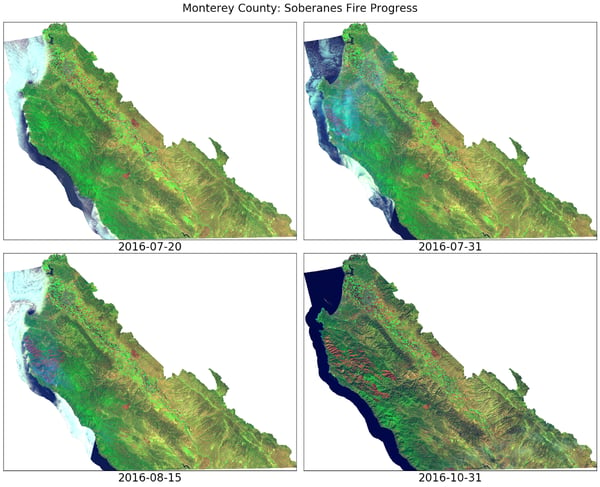
We can see the untouched Big Sur wilderness in a Landsat 8 mosaic of the Monterey peninsula area taken just days prior to the start of the Soberanes fire. The other red small “scars” visible in the image are from other wildfires that had recently occurred in the region, including the Curry Mountain fire near Coalinga. We see imagery from the end of July showing the Soberanes fire actively burning and generating a lot of smoke (cyan haze). Over the months of August and September the fire continued to grow and leave a significant burn scar, estimated by the officials to be over 132 thousand acres.

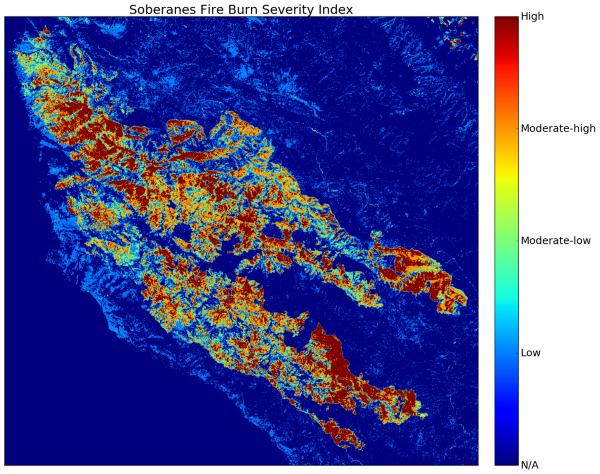
We can now compute the DNBR between the mid-July and early-October imagery (above) and threshold it for the subset of the FireMon categories relevant to active fires (i.e., exclude the “regrowth” categories). The resulting five categories of burn severity and the associated areas are shown in my burn severity map below for the Soberanes fire, highlighting the exact fire perimeter, as well as the low to moderate-low to moderate-high to high-severity burned pixels at 30m resolution.
From the intensity map, we are also able to quickly get a mask (below) of the burn scar and automatically compute the fire contour using a few simple functions available in the Python skimage module. I applied a hard thresholding on DNBR at a value of 0.1 , which results in a mask containing only pixels that indicate any degree of burn, however small.
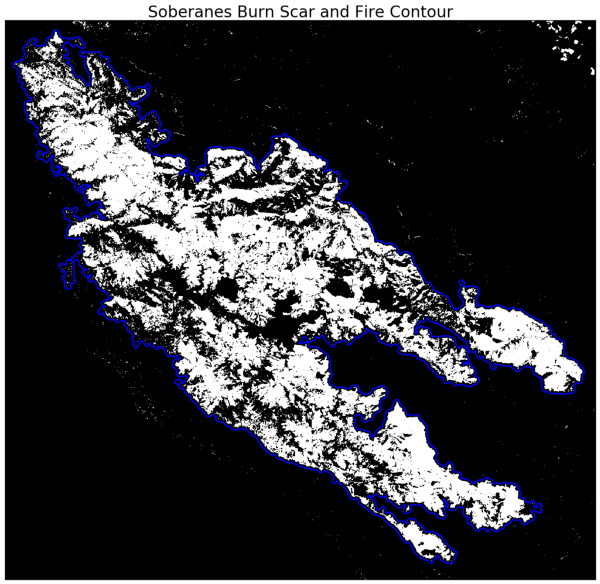
We can use this mask now to compute an estimated actual burned acreage by multiplying the total number of burned pixels with the equivalent acreage of a pixel (0.22 ac/Landsat pixel), resulting in 112,376 burned acres. This is approximately 20 thousand acres less than the number estimated by the fire officials at the time, and we speculate that this mismatch is due to the fact that our implementation accounts only for burned pixels within the fire contour as defined by our threshold.
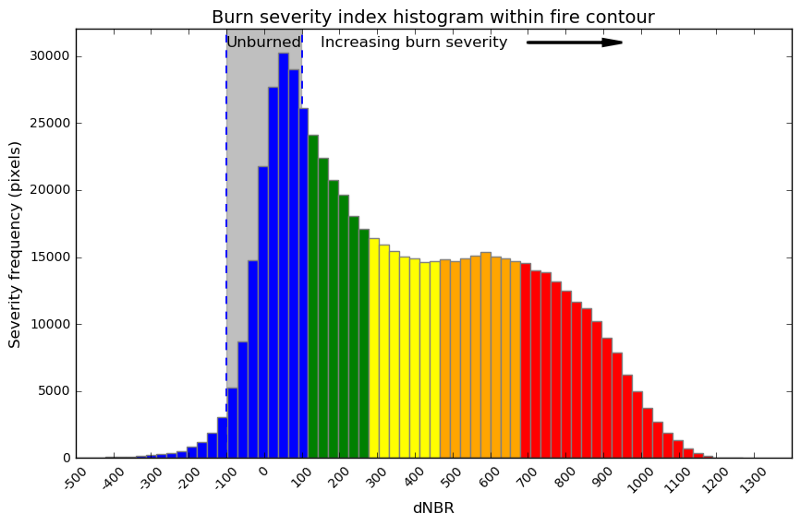
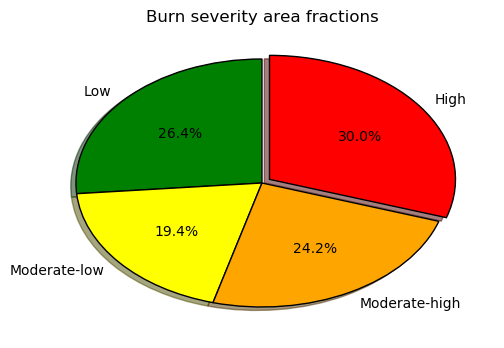
Another useful way to look at a wildfire burn severity map is to look at the distribution of NDBR values within the fire perimeter. I used Python’s skimage and matplotlib libraries to make such a histogram showing the DNBR distribution within the fire contour and an associated pie chart showing relative percentages of areas by burn severity for the burned pixels. Recall that one of the main attractions in the Big Sur wilderness is its impressive ancient redwood groves. Although the thick bark of older trees is relatively fire resistant, young growth can be seriously injured or killed outright by fire. According to our analysis, roughly 44 percent of the burn scar pixels exhibit moderate-low to moderate-high degrees of severity—meaning light to deep charring to understory, with the overstory (tree crowns) exhibiting some degree of scorching. Thirty percent of the burn scar was associated with a high burn severity index—meaning likely understory and overstory have been consumed in those areas, including most branching in the crowns.
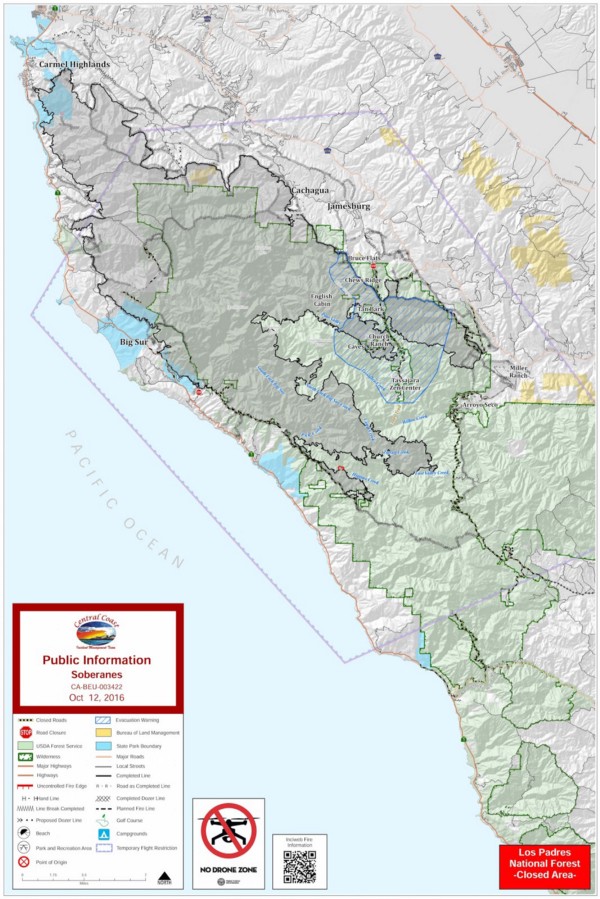
See for yourself. Here’s the final fire perimeter map published on October 12, 2016. Note that the official fire perimeter is fairly contiguous compared to our analytically derived one, and includes most interior pixels regardless of whether they were actually burned or not.
Our vast corpus of satellite imagery can help reduce firefighting costs and provide valuable insights to firefighting units, land management bureaus, and insurance agencies. During the course of a fire, especially one with limited allocated resources, satellite imagery analysis could better direct ground crews to hotspot and containment areas, or help identify whether structural damage has occurred, and can do so without the cost associated with an aerial survey. The benefits of using satellite data increase significantly for post-fire assessments by Burned Area Emergency Response (BAER) teams and the US Forest Service. Other remote sensing techniques could also be applied to data covering the burn scar to evaluate not just delayed mortality and vegetative regrowth, but also waterway changes, slope erosion, soil moisture, and rebuilding efforts. In addition to land management use cases, satellite imagery could provide quick insurance-related assessments of structure damage or loss and prevent lengthy payout delays due to lack of property access or adjuster availability.
Join the Descartes Labs Platform Beta today and try out my wildfire assessment example Jupyter Notebook to analyze your wildfire of choice.