Article category: Mining, Science & Technology
Sentinel-1 at Descartes Labs: An Overview
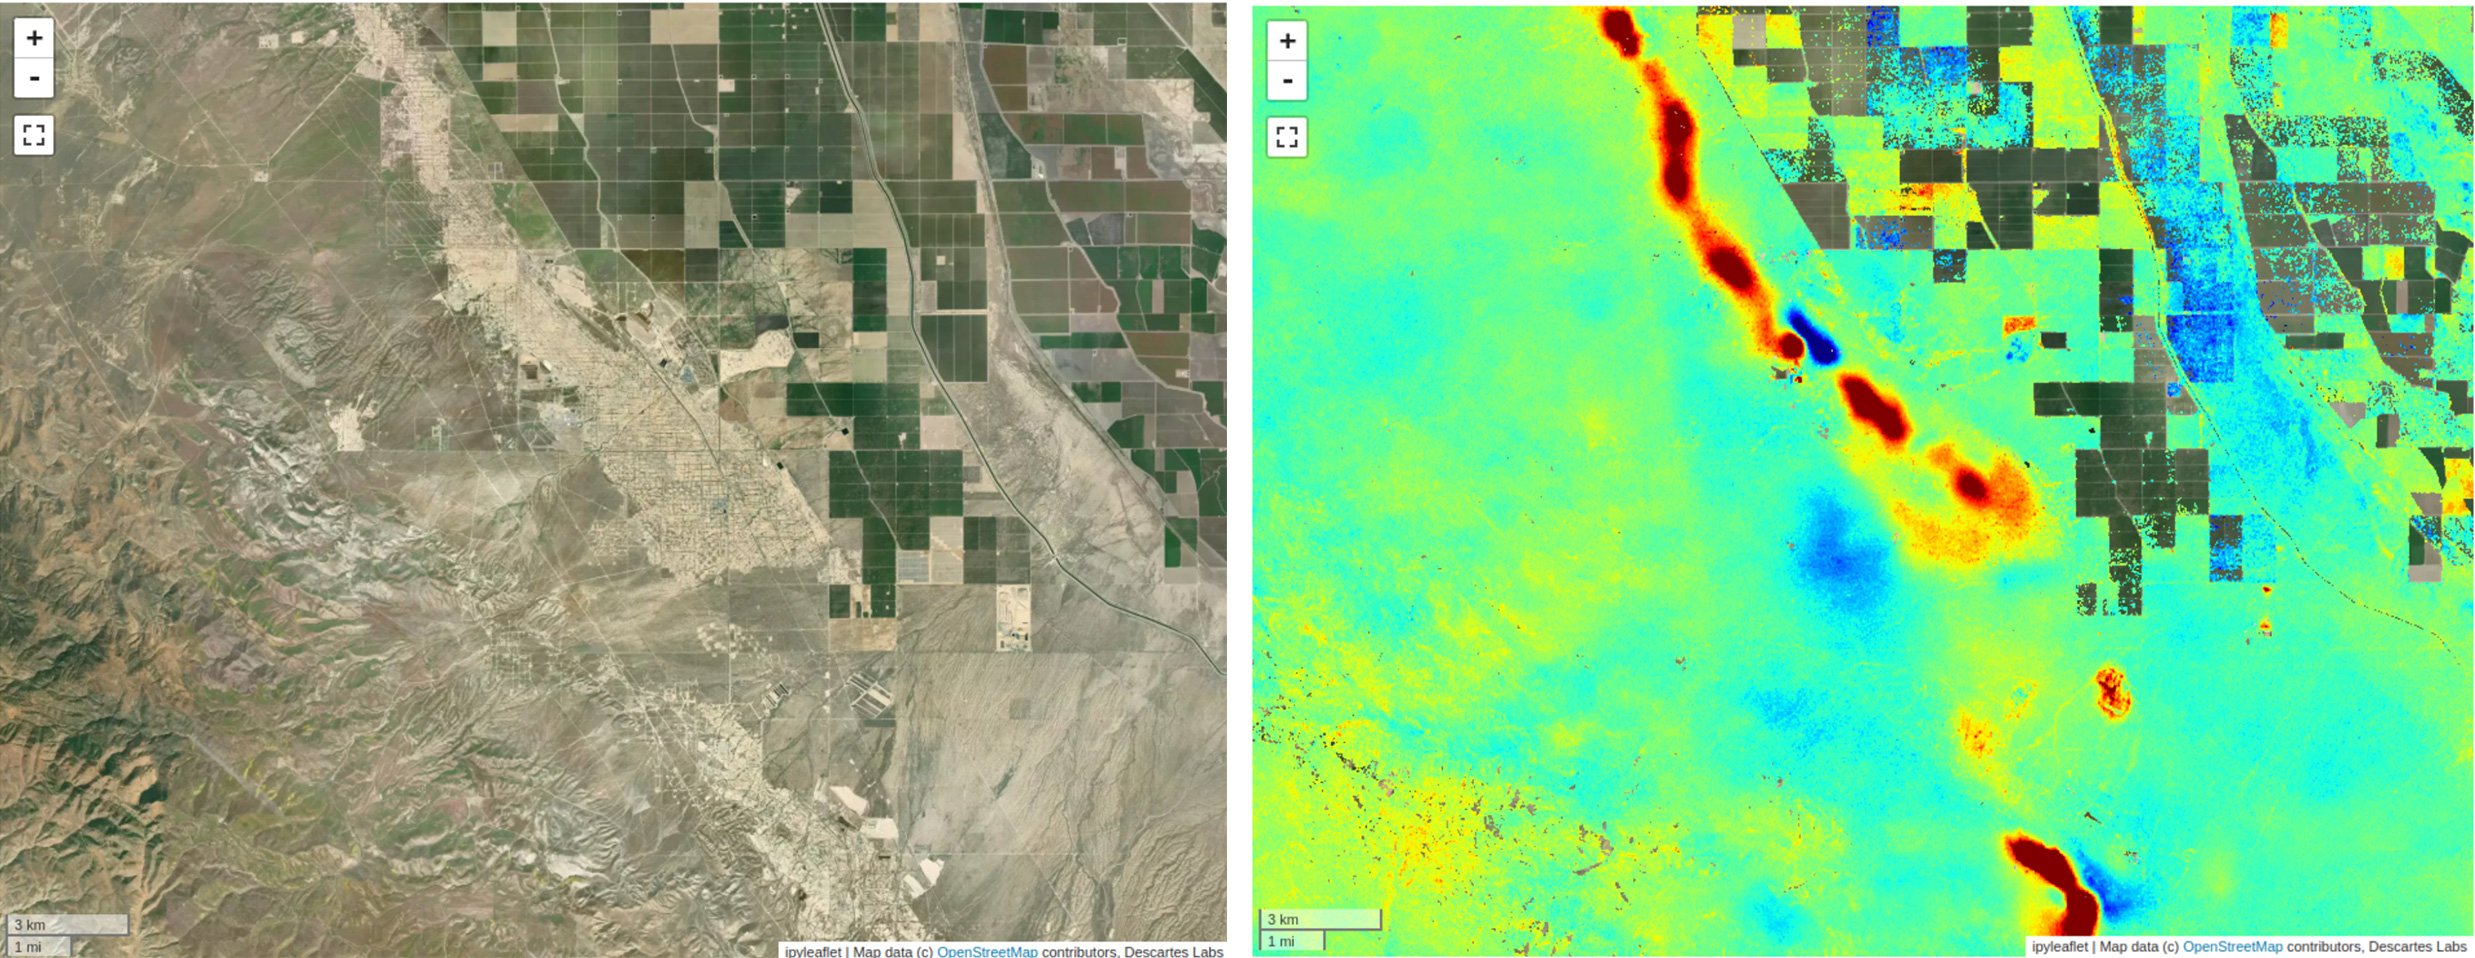
Synthetic Aperture Radar (SAR) provides a valuable remote sensing tool, and this blog post will...
Product Overview: Marigold is a GIS-like user interface, built for the exploration geologist, which enables common remote sensing workflows including lithological and mineral mapping, advanced spectral mapping, and lineament analysis without requiring an advanced understanding of remote sensing. This increases the productivity, speed, accuracy, and confidence of greenfield exploration, while reducing overall cost.
Marigold 2.1.0 introduces a range of exciting new features designed to enhance your mineral exploration workflow. Alongside performance enhancements that boost processing speeds, you'll discover fresh capabilities within the Vector Layer, Spectral Plot, and Catalog interfaces.
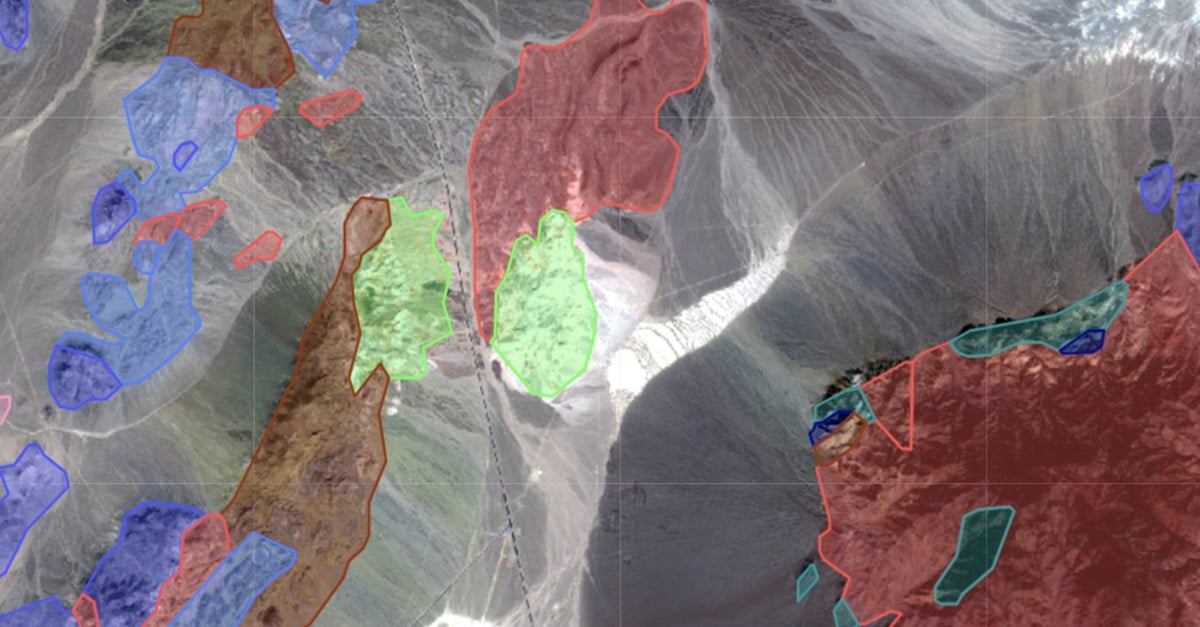
Users now have the ability to customize the appearance of vector layers using the settings dialogue located under the layer's three dot menu. This feature allows users to have control over the border color, fill color, and opacity of polygon, line, and point vector data. Moreover, users can also apply thematic coloring to vector layers that contain additional data columns, based on feature properties such as rock type for a geological map, geochemical values for soil or rock samples, or by property owner for a land tenure dataset.

USGS geologic mapping polygons over Cuprite, NV. Opacity is modified to the users preference and the polygons are then automatically colored by geologic unit name.
Numerous features have been added in this release to help you get the most out of your spectral data. Users are now able to import spectra from a variety of industry-standard sources including ASCII formats associated with products such as ENVI and from field instrument spectrometers such as the Terraspec Halo in ASD format. Support for field-collected spectra allows users to apply ground-truthing to their spectral exploration and is crucial for analyzing and interpreting hyperspectral datasets.
Additionally, users now have the option to export any spectra from their Marigold session, including those queried from imagery in Marigold, and import those spectra collections directly into another Marigold session.
Improvements to the spectral plot itself include a new toggle button that controls the visibility of all spectra in the plot as well as navigational improvements within the plot itself. Adding, removing, or toggling the visibility of spectra no longer resets the extents of the plot, allowing you to more efficiently assess features and differences between your field and scene collected spectra.

Visualization of scene-collected spectra from the Fused BEC at Cuprite, NV. A subset of spectra are compared and selected, then exported into a single .SPEC library that can be imported into a separate Marigold session.
We've given the Raster Catalog a makeover to make it even easier for you to find and explore the products available through your Descartes Labs subscription or uploaded by your organization. Now, you can search the catalog by product title and tags. The available layers are automatically organized by tags such as imagery, geophysics, topography, or hyperspectral, allowing you to quickly find and start exploring your datasets.
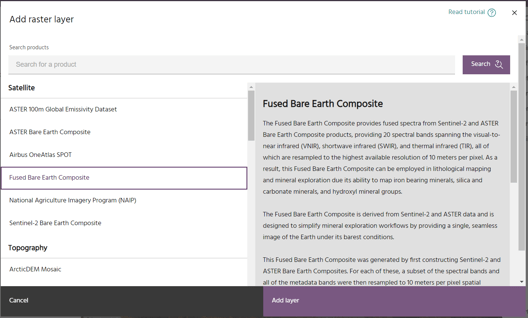
Improved Raster Catalog with a new search features and tag-based organization.
![]() Stay tuned for more on Hyperspectral datasets in Marigold!
Stay tuned for more on Hyperspectral datasets in Marigold!