Article category: Science & Technology, Climate Solutions
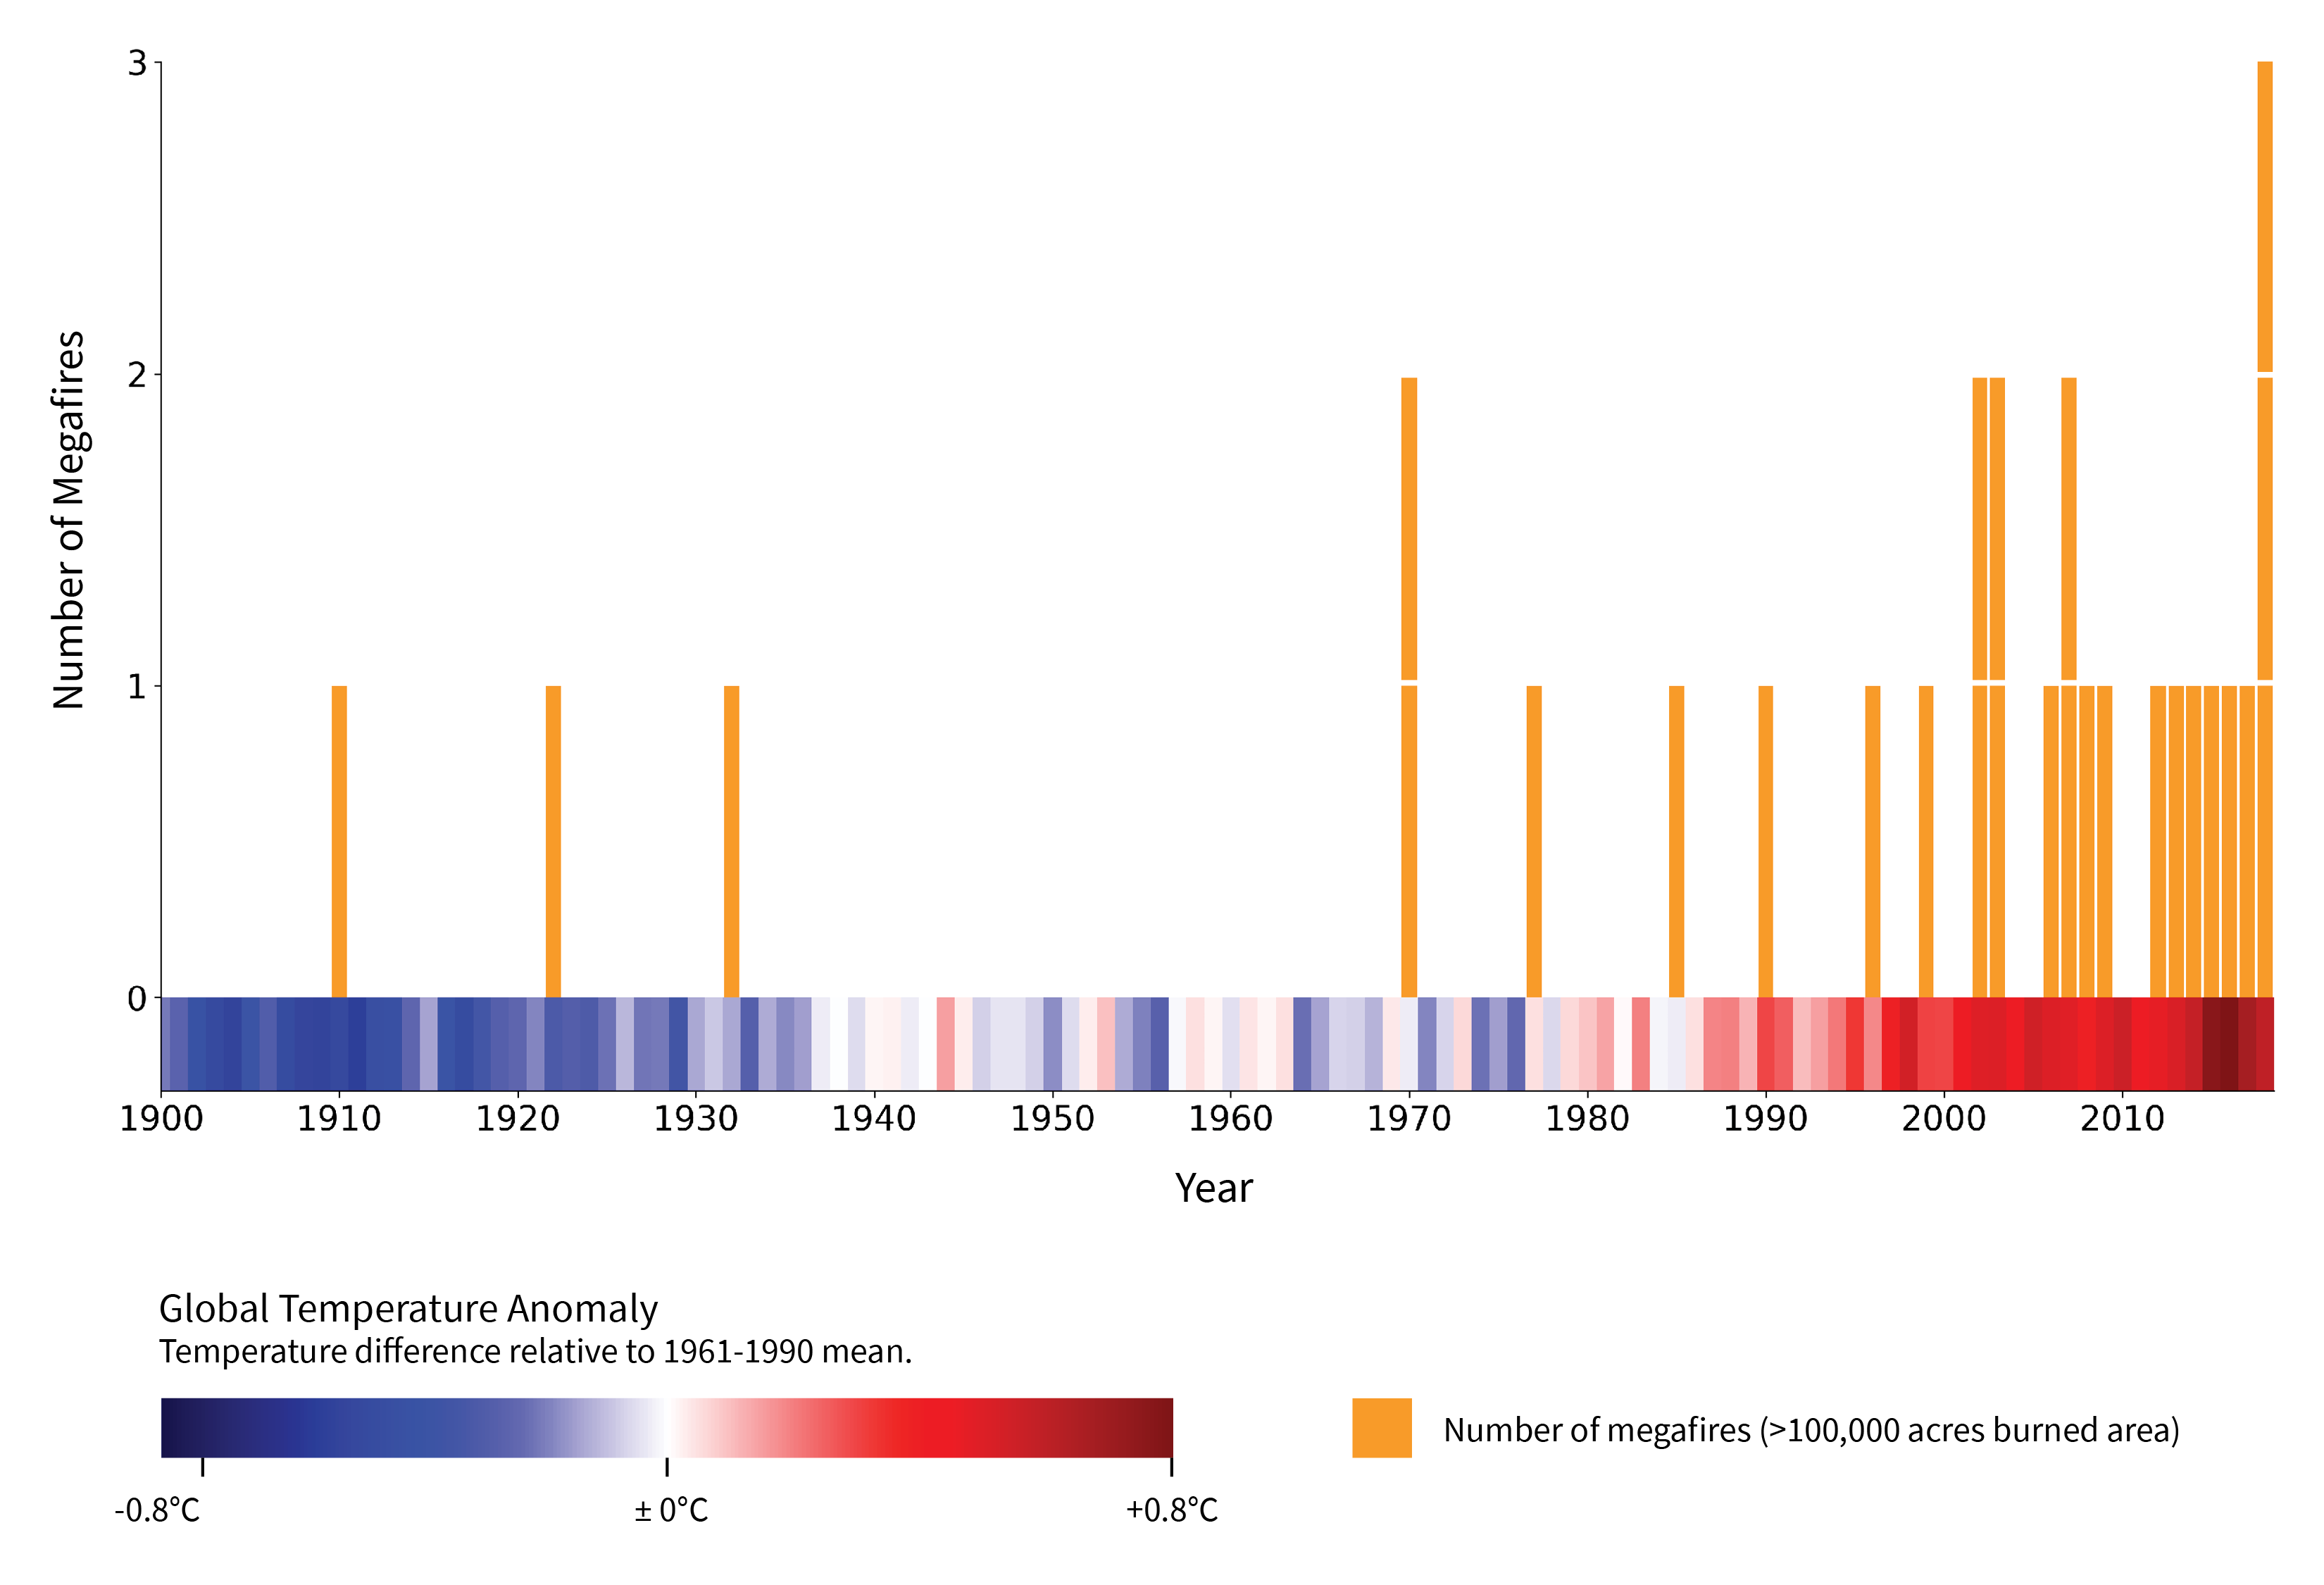
Assessing the damage of California’s wildfires
Over the past week, we’ve watched in horror as wildfires tore across Northern California. With a...

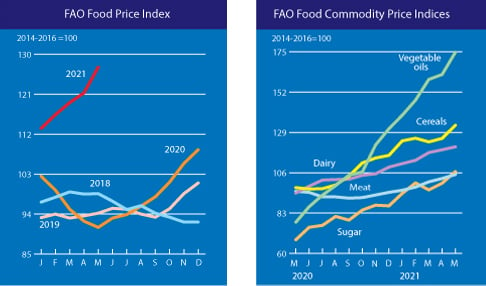
A recent report by the UN FAO Food Price Index saw global food prices reach their highest levels in a decade in May, up 4.8% compared to April and 39.7% since the same time last year. Vaccine rollouts and sluggish supply chains still facing pandemic-related restrictions drove increased demand for basic commodities like soybeans, sugar, vegetable oils, meat, and dairy.
Raw material inflation has been on a tear in 2021, flattening product margins and pushing up consumer prices. The question is whether these food prices are transitory or if it's the beginning of a new phase brought on by aggressive stimulus and overheated demand?
Upstream of these macro questions are the farmers, suppliers, traders, merchants, distributors, and procurement professionals that make the agriculture system function. If you fall in one of these roles, your overall goal is pretty straightforward: deliver or procure a great product in a consistent way and at an affordable price. Unfortunately, your goal is extremely complex due to the global size and hyperconnected nature of today’s commodity markets. Ultimately, these markets are complex adaptive systems that evolve out of different groups of people acting in dynamic and interconnected ways. As such, they are challenging to forecast without the right information.
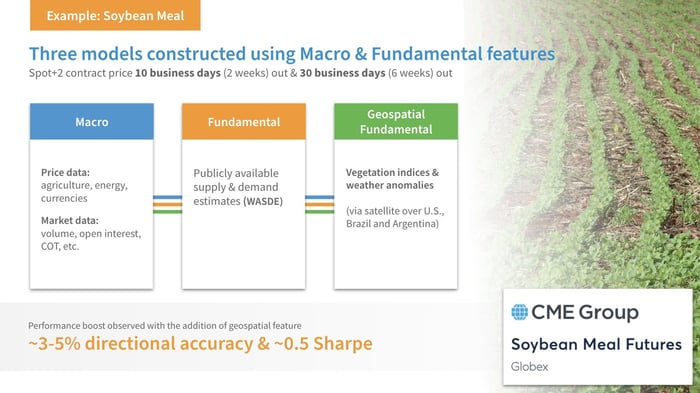
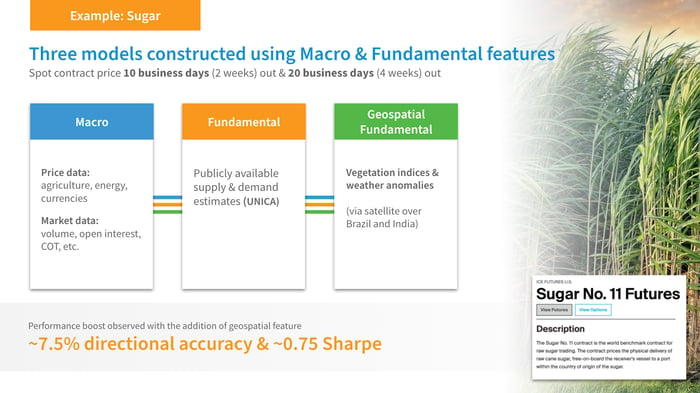
Considering this complexity in today’s market, how do we attempt to model this living information system? And what factors matter most? Take soybean meal for example. Why is it that next month's corn price, its 50 day mean price, today’s soybean price, satellite NDVI measurements, and change in net contracts traded affect prices 10 days out? Or the next 20 days? Or two quarters from now?
These factors capture events that we can all intuitively understand but often struggle to quantify (or even estimate!) We all recognize that weather in South America at certain stages of the growing season is significant. The trick is putting accurate numbers to its importance, including how and when these events affect price.
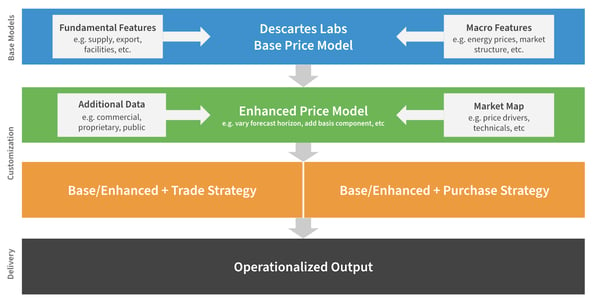
A solution to this challenge are the price forecasting packages we’ve developed for sugar, palm, corn, and the soy complex. Each consists of three different price prediction models (fundamental, macro, and geospatial) for futures and cash markets that can be enhanced with additional internal or proprietary data. Customized models are possible to deliver in less than 12 weeks and include our geospatial data science platform for ad hoc analyses and in-house feature generation.
Here are a few examples:
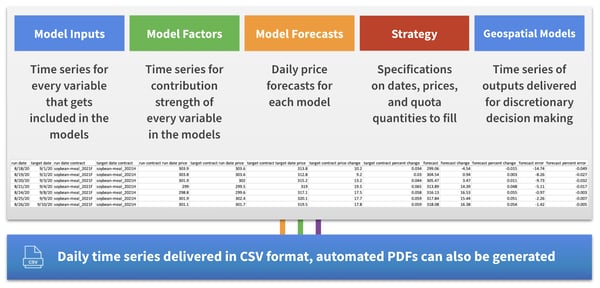
Layered on top of the combined models are AI/ML algorithms that make sense of how to use the information to implement a successful purchasing strategy. Depending on the time of year and other factors, the purchasing algorithm we created takes the three price models and synthesizes them to make a purchasing decision to fill your contract quota in an agreed-upon time.
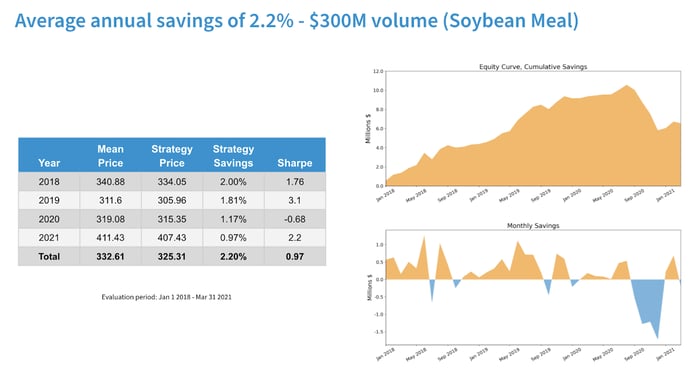
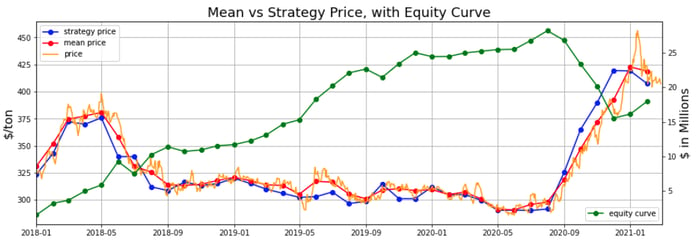
The model assumptions include a monthly quota schedule and a six-week purchasing window. A very straightforward way to fill that quota would be to just spread out the quota evenly over the 6 weeks, and the resultant mean price of that is what we consider our mean price benchmark.
The strategy is optimized to perform better than that mean price, and you can see in the graphic below that over the 2018 - 2021 period we achieve 2.2% savings over the benchmark. We consider this period because it is a blind period, meaning data was hidden during model development and is thus the most indicative of live performance.
Ultimately, what we offer is a suggestion for when to buy contracts. Equally important, we share what contributed to that suggestion, in a forecast that arrives in your inbox every day. You can see how heavily weighted each signal is, and you can make purchasing decisions based on if you disagree with any of our signal weightings.
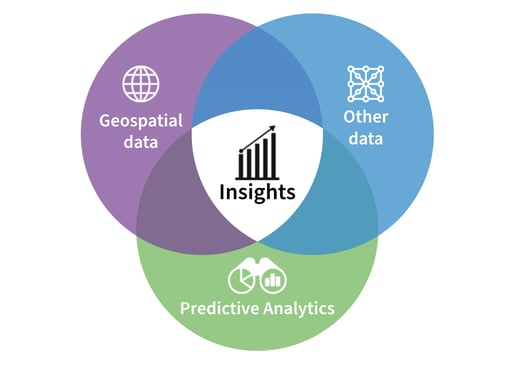
Our specialized geospatial data is great for monitoring large-scale physical supply chains such as agriculture, but to truly deliver business value, firms need to combine geospatial data with other traditional data sets to drive true competitive advantage.
Some tangible examples are provided below:
The futures market is 10x the fundamental physical value of the market. This is largely what drives volatility in the marketplace. Algorithms recognize trends, begin automatically trading. Demand and supply matter but short-term volatility comes from the technical side, where speculators, index funds, and non-commercial funds are investing. There are situations where fundamentals are behind a 10 dollar rise in prices, but the algorithms will notice a trend and begin trading, causing a shift of 70, 80, 90 dollars. Fundamentals eventually cause the market to correct, but the technical side is causing the volatility in the short term. We offer a way to weather that volatility by copying the algorithmic pricing style of these technical players.
The models and the resulting strategy are not going to perform perfectly all the time. Part of the value of the strategy is that it is balancing out the various periods of underperformance of the models and still making smart purchasing decisions. Despite that, there can still be periods of extreme market volatility in which the strategy stumbles. In the long run, we are confident the strategy performs profitably, and part of using systematic strategies is not letting emotions intervene and trusting your backtest, and knowing that periods of underperformance will come to an end.
However, that doesn’t mean something can’t be done to take action during periods of extreme volatility. We show a few things in the chart below: you have the equity curve we previously showed as the green line. The blue and red lines show the monthly strategy and mean benchmark prices, respectively, along with the daily prices in the orange line. We see the strategy price improving on the mean price most of the time. At the right, when prices begin climbing very quickly, we see the strategy price begin to underperform against the benchmark. In periods of rapidly rising prices that means a benchmark can be difficult to beat.
On the bottom chart, we see risk metrics for each of the 3 models; these metrics are based on an assessment of each model’s performance over a rolling window, and when models begin to underperform continuously, this number gets more negative.
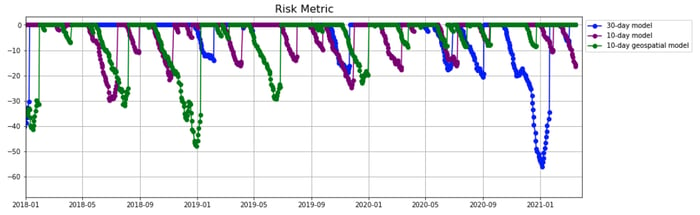
Watching this unfold in real-time, from the equity curve we’d notice a third period of strategy underperformance (red circle) when historically the streak has been no more than 2 periods of underperformance; additionally, on the bottom plot we see the 30-day model (crucial to the strategy, as it is your long view for the quota period), begin to correct but then plunge into high risk territory. At this point, these two indicators would have triggered the notification from us that purchasing should be halted, and all models, factors, and inputs should be analyzed along with some discretionary action to mitigate risk.
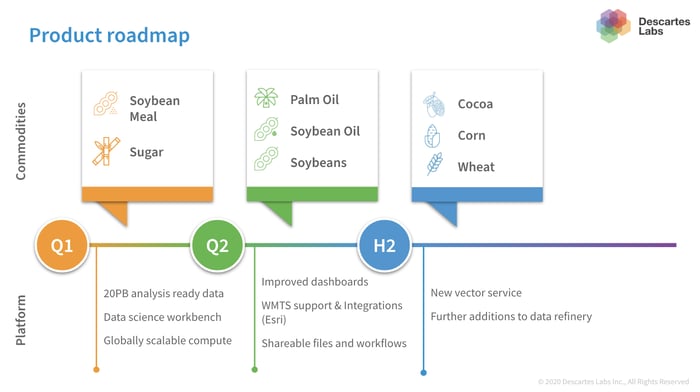
In addition to the soybean meal and sugar base models described above, Descartes Labs is in the midst of developing models for the rest of the soy complex as well as offering a base model for palm oil. Once those commodity base models are complete, we have corn, cocoa, and wheat in our sights for the rest of the year. The general availability of these base models mean they can be immediately enhanced to fit your strategy and incorporate your data.
If you are interested in a commodity not listed above, reach out to our team to learn more about our custom development engagements.