Article category: Mining
Get to Know Marigold (Part 5): Marigold Workflows & Derived...
In this blog, we will walk through how to create a series of standard multispectral derived...
In this blog, we continue our exploration of Marigold's Workflows & Derived Products on creating standard multispectral derived products in the Descartes Labs’ Marigold software.
The workflow in this video requires that you have already masked your data as shown in our Simple and Complex masking videos, as well as created the derived products as shown in Marigold Workflows and Derived Products, 1 of 3. Please watch those videos above (Part 3, 4, and 5) before continuing.
Now let's get started on how to create an R-G-B Ternery Product (or T-Ratio) and a Decorrelation Stretch product.
The first product we are going to make is the R-G-B Ternery Product Thirteen(13) or T-Ratio-thirteen(13). R-G-B Ternery Products are created by mapping a combination of three (3) selected mineral indices to each of the red, green and blue bands in an R-G-B product. A selection of possible R-G-B Ternery products or T-Ratios are listed in the DL Multispectral Processing worksheet for your reference.
To create this Ternery Product, we will combine multiple band ratios and mineral indices that we already produced.
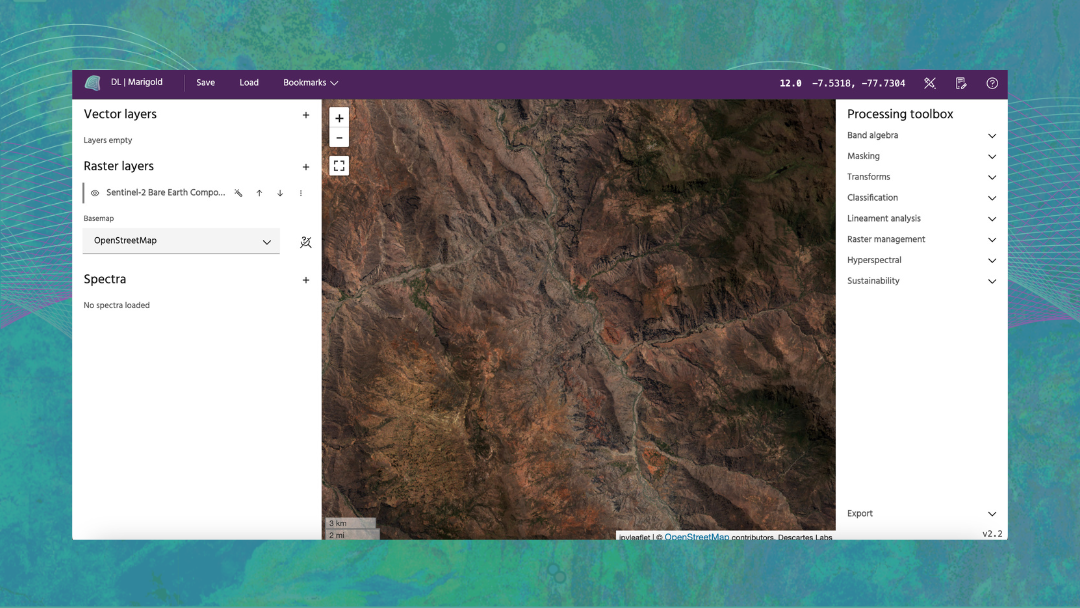
In the processing toolbox, expand Raster Management and select Merge Layers. Click the Add Layer button until you have 3 total layers.
To generate the T-Ratio-thirteen, choose the following 3 mineral indices: the “A-L-O-H band six ” mineral index, the “Ferric Oxide Composite” mineral index, and the “F-E-O-H band seven ” index.. Next, provide a name that references the original masked product and the new RGB product, such as Fused v-s-w-mask T Ratio 13. Finally, click “Merge.”
By default, the newly created layer displays in single-band mode. To change this, open the three dot menu next to the TRatio layer, and select Settings. Within the settings panel, toggle the “Band Configuration” to RGB.
If you scroll down, you’ll see that the red, green and blue bands automatically populate in the order you provided the layers during the Merge Layer process. The “A-L-O-H band six (6)” mineral index is mapped to the Red Band, the “Ferric Oxide Composite” mineral index is mapped to the Green band, and the “F-E-O-H band seven (7)” index is mapped to the Blue band.
We recommend that you double check the automatically-assigned names of the bands, since these names will display in the viewport’s legend. The band names are auto-generated based on the remote sensing processing tool used, and they may not accurately reflect the product.
To change, click Rename Bands. Change the incorrect band name. Then click Update band names.
Click Apply to save all your changes.
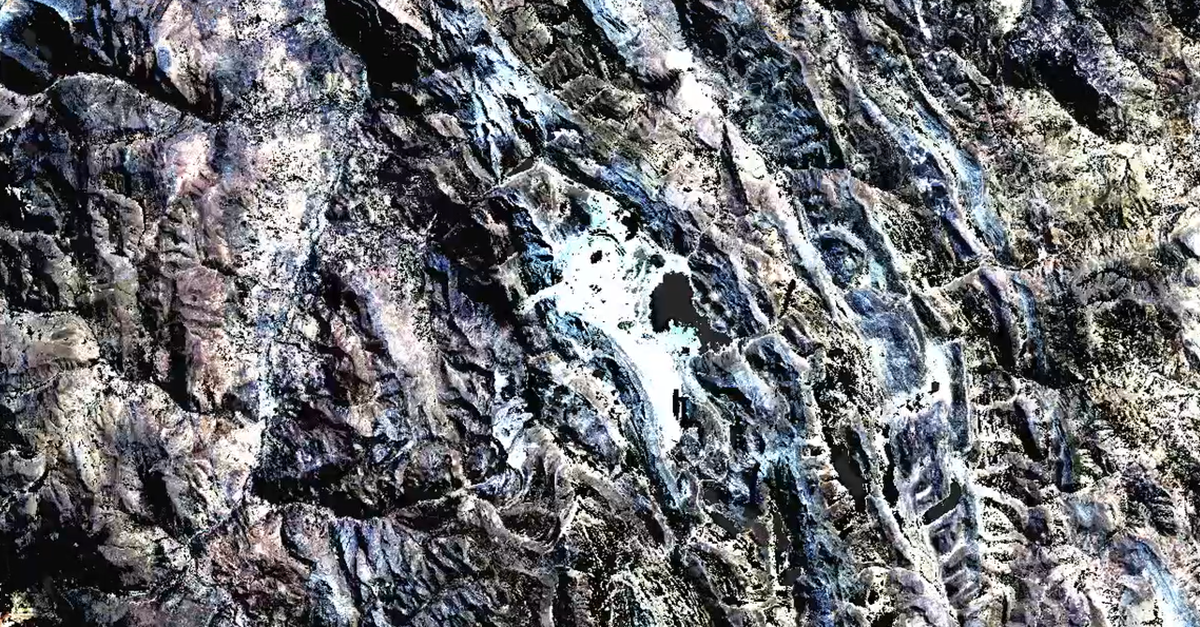
Next, click the magic wand button on the TRatio layer to perform a 2% contrast stretch of the data. This balances the autoscaling for each band and generates a product that helps highlight hydrothermal alteration over this area.
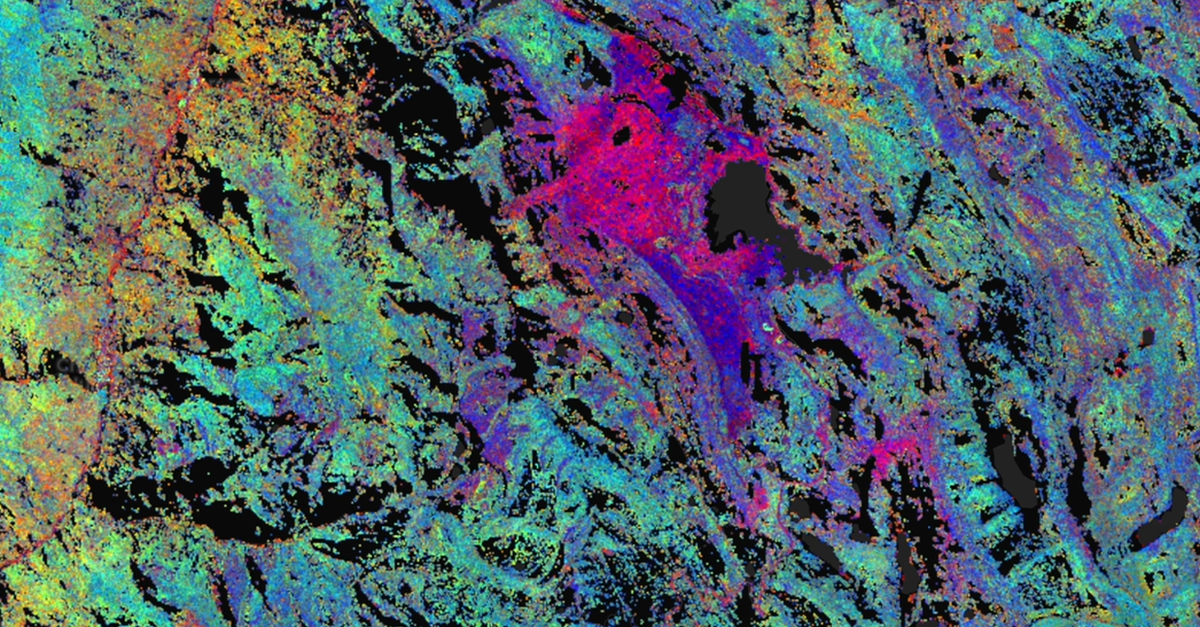
Next, let’s generate a decorrelation stretch, or D-C, which is used to enhance the color differences found in an RGB product by using three input bands.
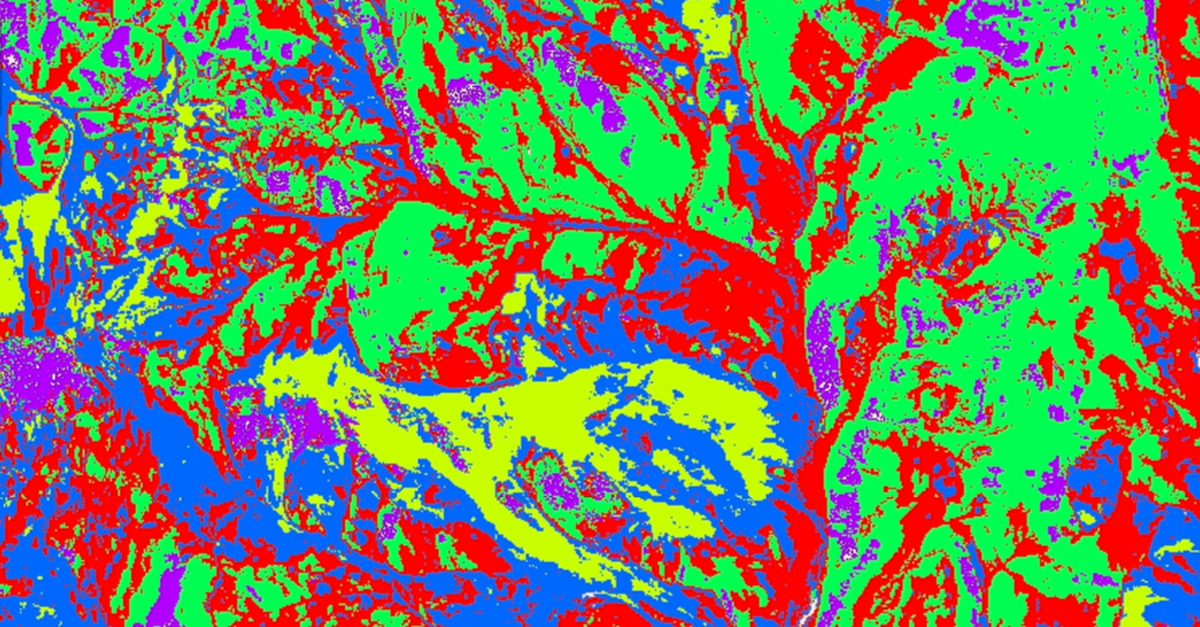
To demonstrate, we are going to use the “ASTER five six eight equivalent” R-G-B product as an input. This is an R-G-B that shows the responses for ASTER bands five, six , and eight mapped to red, green and blue, respectively. Although it can give a strong response in certain environments, in our example it gives a relatively subtle product. Typically, hydrothermal minerals with absorption features in ASTER bands five and six have responses that are pink or purple, whereas responses from ASTER band eight are yellowish. In this example, some pinks and purples are present, but they are relatively subtle. We will use a decorrelation stretch to help enhance this response.
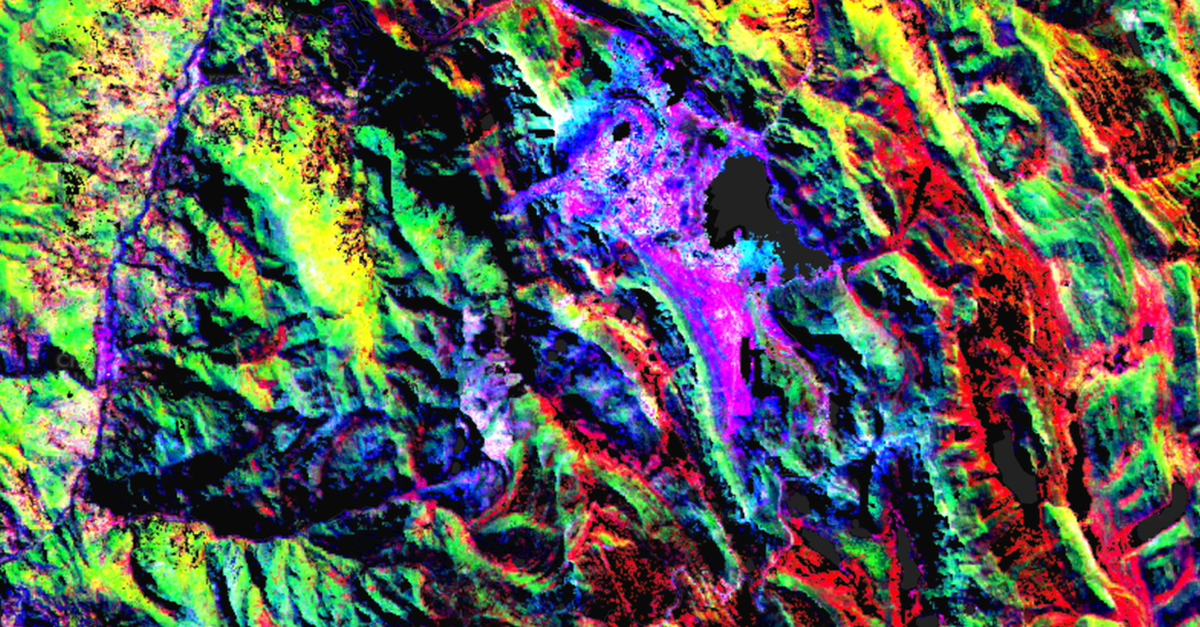
In the Marigold processing toolbox, expand Transforms and select Decorrelation Stretch. For the input product, select the “ASTER five six eight (5-6-8)--equivalent.” Provide an appropriate name. The standard nomenclature is to append “D-C” to the name. Then click on “Run D-C-S”. As you can see, the result is much more vivid than the original product.
This concludes our training on how to create a TRatio and perform a Decorrelation Stretch in Marigold.
![]() Stay tuned for the third and last installment on how to create a series of standard multispectral derived products in Marigold in Get to Know Marigold (Part 7): Workflows & Derived Products, 3 of 3.
Stay tuned for the third and last installment on how to create a series of standard multispectral derived products in Marigold in Get to Know Marigold (Part 7): Workflows & Derived Products, 3 of 3.
Interested in our Marigold product? Connect with Sales to schedule a consultation.