Article category: Mining, Science & Technology
Improvements in Mineralogical Classification with Increased...
A case study over Cuprite, Nevada comparing Fused Bare Earth Composite and EnMAP Data
We are at a unique point in time in our industry in terms of hyperspectral remote sensing development. After more than two decades of anticipation, we are in the early days of data assessment following the launch of multiple spaceborne hyperspectral instruments, with a plethora of new instruments being planned, in development, or on the launch schedule. Each instrument has its own unique specifications depending on the mission objectives, but the main categories for the instruments of interest in our industry are: Visible to Near Infrared to Short Wave Infrared (VNIR-SWIR) wavelength coverage, number of bands, spectral resolution, spatial resolution, and above all - signal to noise, because without enough signal the data is not usable (Kruse, 2002). Overall, the utility of the data from each spaceborne instrument will be contrasted and compared against other more traditional (airborne) or newer (drone-based) hyperspectral sensor data, all with the objective of examining the ability of these sensors to identity and map minerals of interest in the mineral deposit system in question, at what specifications and cost.
With that broader objective in mind, the focus of this investigation is to compare the impact of higher spatial resolution on the accuracy of mineral mapping results between data from two hyperspectral sensors, namely the regional-scale EnMAP spaceborne hyperspectral sensor with a spatial resolution of 30 m, versus a local-scale SpecTIR airborne hyperspectral sensor dataset collected at a very high resolution of 1 m. The site of the study is the Cuprite, Nevada spectral reference site, a low-sulfidation epithermal system with high sulfidation overprinting (Swayze et al., 2014). The specific objective of the study from a mapping and remote sensing perspective is to assess the ability of the sensors to identify and map a selection of the hydrothermal and geothermal minerals associated with the western and eastern alteration centers of the deposit, documenting how the difference in spatial resolution of the sensor, relative to the size of a showing, impacts the ability to map both compositional and crystallinity differences in the system, referencing the detailed ground truthing and mapping previously done by Swayze et al. (2014). These observations will provide guidance for the future on the limitations of alteration mapping with regional-scale hyperspectral mapping data, as well as insights on endmember identification, sub-pixel spectral unmixing and processing guidelines in the future.
The high resolution airborne hyperspectral dataset used for this study was collected over Cuprite by SpecTIR in 2023, using an SpecIM AISA Fenix-1K sensor with 1024 channels with 325 bands over the VNIR-SWIR (400 to 2450 nm). The data has a typical spectral resolution of 2.6 nm in the visible, 6.3 nm in the SWIR and a spatial resolution of 1 m. A total of 13 flightlines were collected, and the data was radiometrically and geometrically corrected, converted to surface reflectance and mosaiced by SpecTIR before it was shared with Descartes Labs.
EnMAP is a new hyperspectral sensor launched on 1st April, 2022 by the German Aerospace Center (DLR). It has 246 spectral bands over the VNIR-SWIR (400 to 2450 nm) with a spectral resolution of 6.5 nm in the visible and 10 nm over the SWIR, and a spatial resolution of 30 m. Data collected in the EnMAP archive was recently made available by the DLR for commercial data use.
Cuprite is a well-known mineral occurrence in southwestern Nevada. It has been mapped routinely by the remote sensing mineral exploration community as a spectral reference site because of its diverse and prolific advanced argillic and argillic alteration exposures. The deposit has been studied by many researchers (Ashley and Abrams, 1980; Goetz and Srivastava, 1985; Rowan et al., 1985 among others), but the mapping and detailed information collected during ground truthing by G. Swayze et al. (2014) is one of the more comprehensive studies, hence why it was selected as a reference for this investigation.
Both the EnMAP and SpecTIR datasets were ingested into the Descartes Labs catalog and processing for this study was carried out using Marigold, Descartes Labs' online remote sensing interface for mineral exploration.
An effective first visual assessment of the ability of a sensor to differentiate both lithological and surface alteration when mapping on surface is to examine results from a transform, such as Principal Components Analysis (PCA) or Minimum Noise Transform (MNF). Principal components analysis computes new variables (PC’s) from the data’s variance that are constructed as linear combinations or mixtures of the initial variables (spectral bands). These new components are uncorrelated and most of the information within the variables is typically found in the first few components. MNF also sorts these results by noise, with the first component having the lowest noise, etc. When there is significant water or vegetation in a scene, it is always good practice to create a mask for these surface cover types and any other non-outcrop surfaces (e.g. snow) to isolate mapping to geologic cover types.
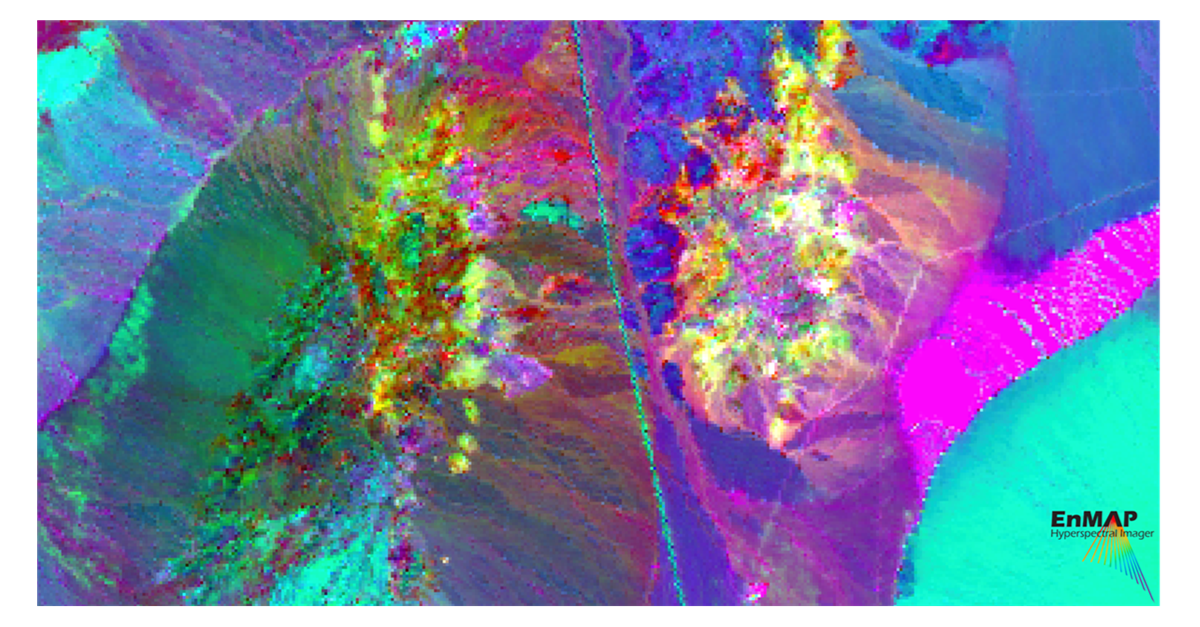
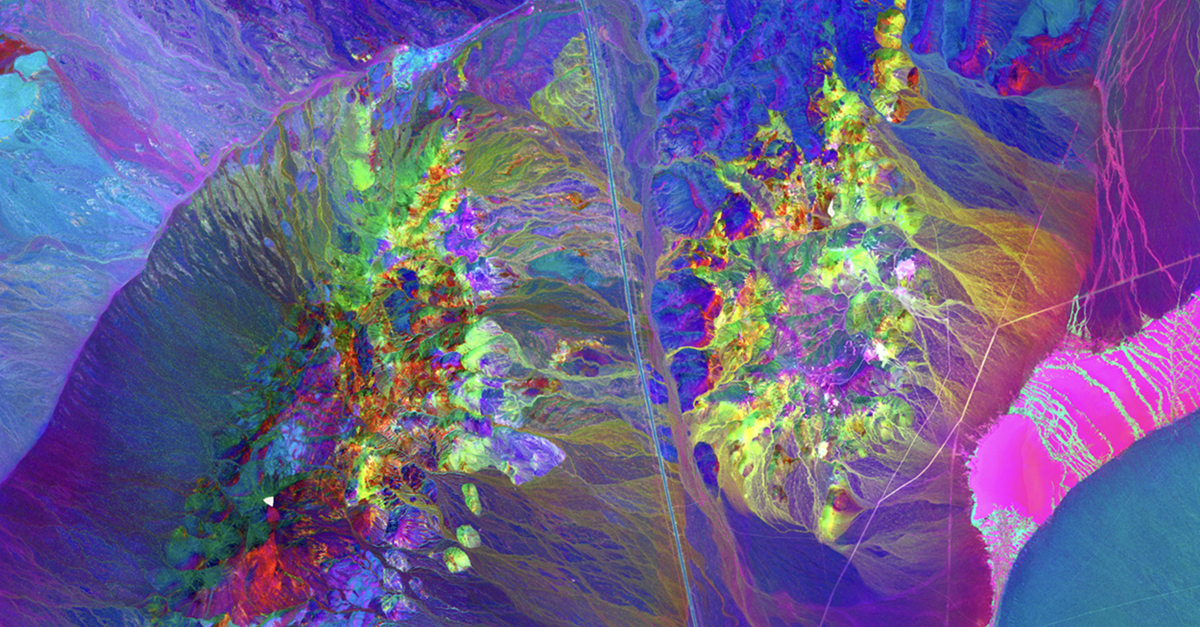
In this case, there is no significant water or vegetation in the scene so masking was not necessary. These techniques map differences in variance of the data through differentiation of compositional complexity, where color is a proxy for composition. A good first comparison of mapping capability between the SpecTIR and EnMAP datasets at Cuprite is shown in Figure 1, which is a PCA123 computed for each dataset, focused over each of the Western and Eastern centers. In regional-scale data such as EnMAP, PCA and MNF RGB mapping results are often very good at differentiating lithology; at Cuprite, the size of the alteration exposures is such that PCA or MNF is also differentiating alteration types and in some cases dominant alteration mineral exposures (Figures 1 and 2). The degree and specificity of the alteration mapped using EnMAP and the SpecTIR data relative to the Swayze et al. (2014) mapping (Figure 3) clearly suggests that much more alteration differentiation is achieved by the higher resolution SpecTIR data (Figure 2), as there is also differentiation visible at the mineral species level from SpecTIR.
Overall however, given the significant difference in spatial resolution between the two datasets (1 m vs 30 m), the results for EnMAP are really very good, and likely attributable to the very careful design of this sensor by the DLR from the point of spectral radiometric and geometric accuracy and signal to noise.
 Figure 1: Differentiation in surface compositional mapping over Cuprite’s western and eastern centers from highly different spatial resolution hyperspectral sensors. SpecTIR HSI airborne data (1 m) (L) versus EnMAP HSI spaceborne data (30 m) (R).
Previous detailed spectral analysis and ground truthing by Swayze et al. (2014) demonstrated and documented the detailed compositional variability of both advanced argillic and argillic (hydrothermal and geothermal) alteration across both the western and eastern centers at Cuprite. The location of reference samples and mapping results from Swayze’s field work are shown in Figure 3, and the position and names of these samples for the EnMAP and SpecTIR data are shown in Figures 2 and 4.
Information on the location of these ground truth samples was provided in Swayze et al. (2014), along with the actual spectral signatures from this work (USGS spectral library), hence it was possible to undertake an in-depth comparison of the characteristics of the reference sample spectral signatures for each of the datasets examined. A selection of these results are presented here in this document.
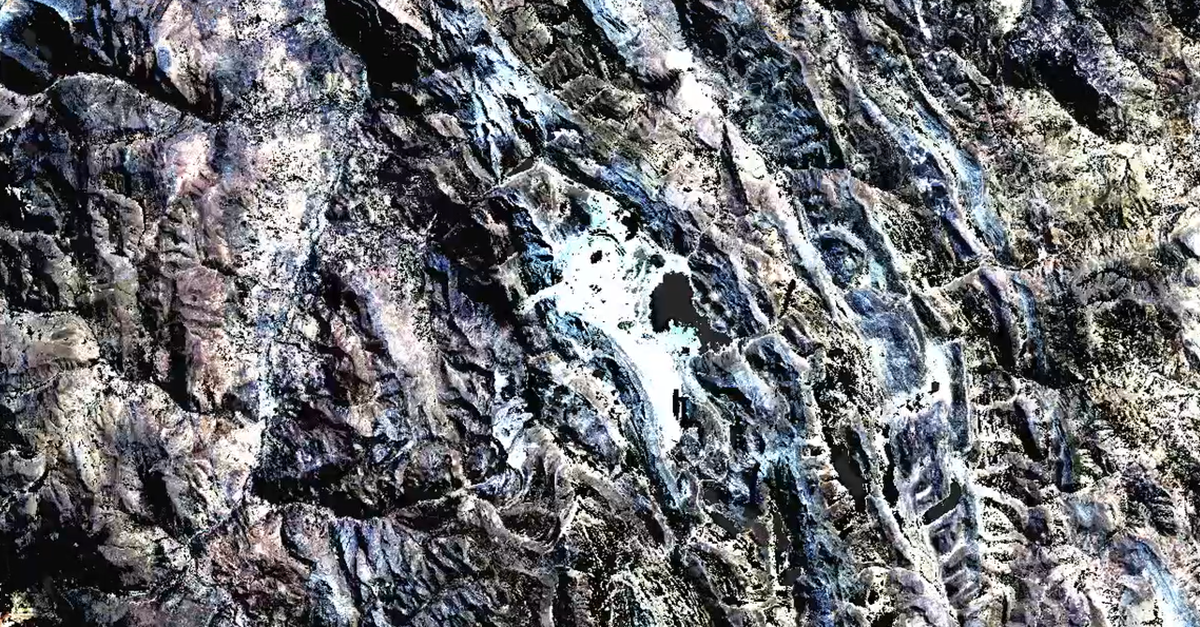
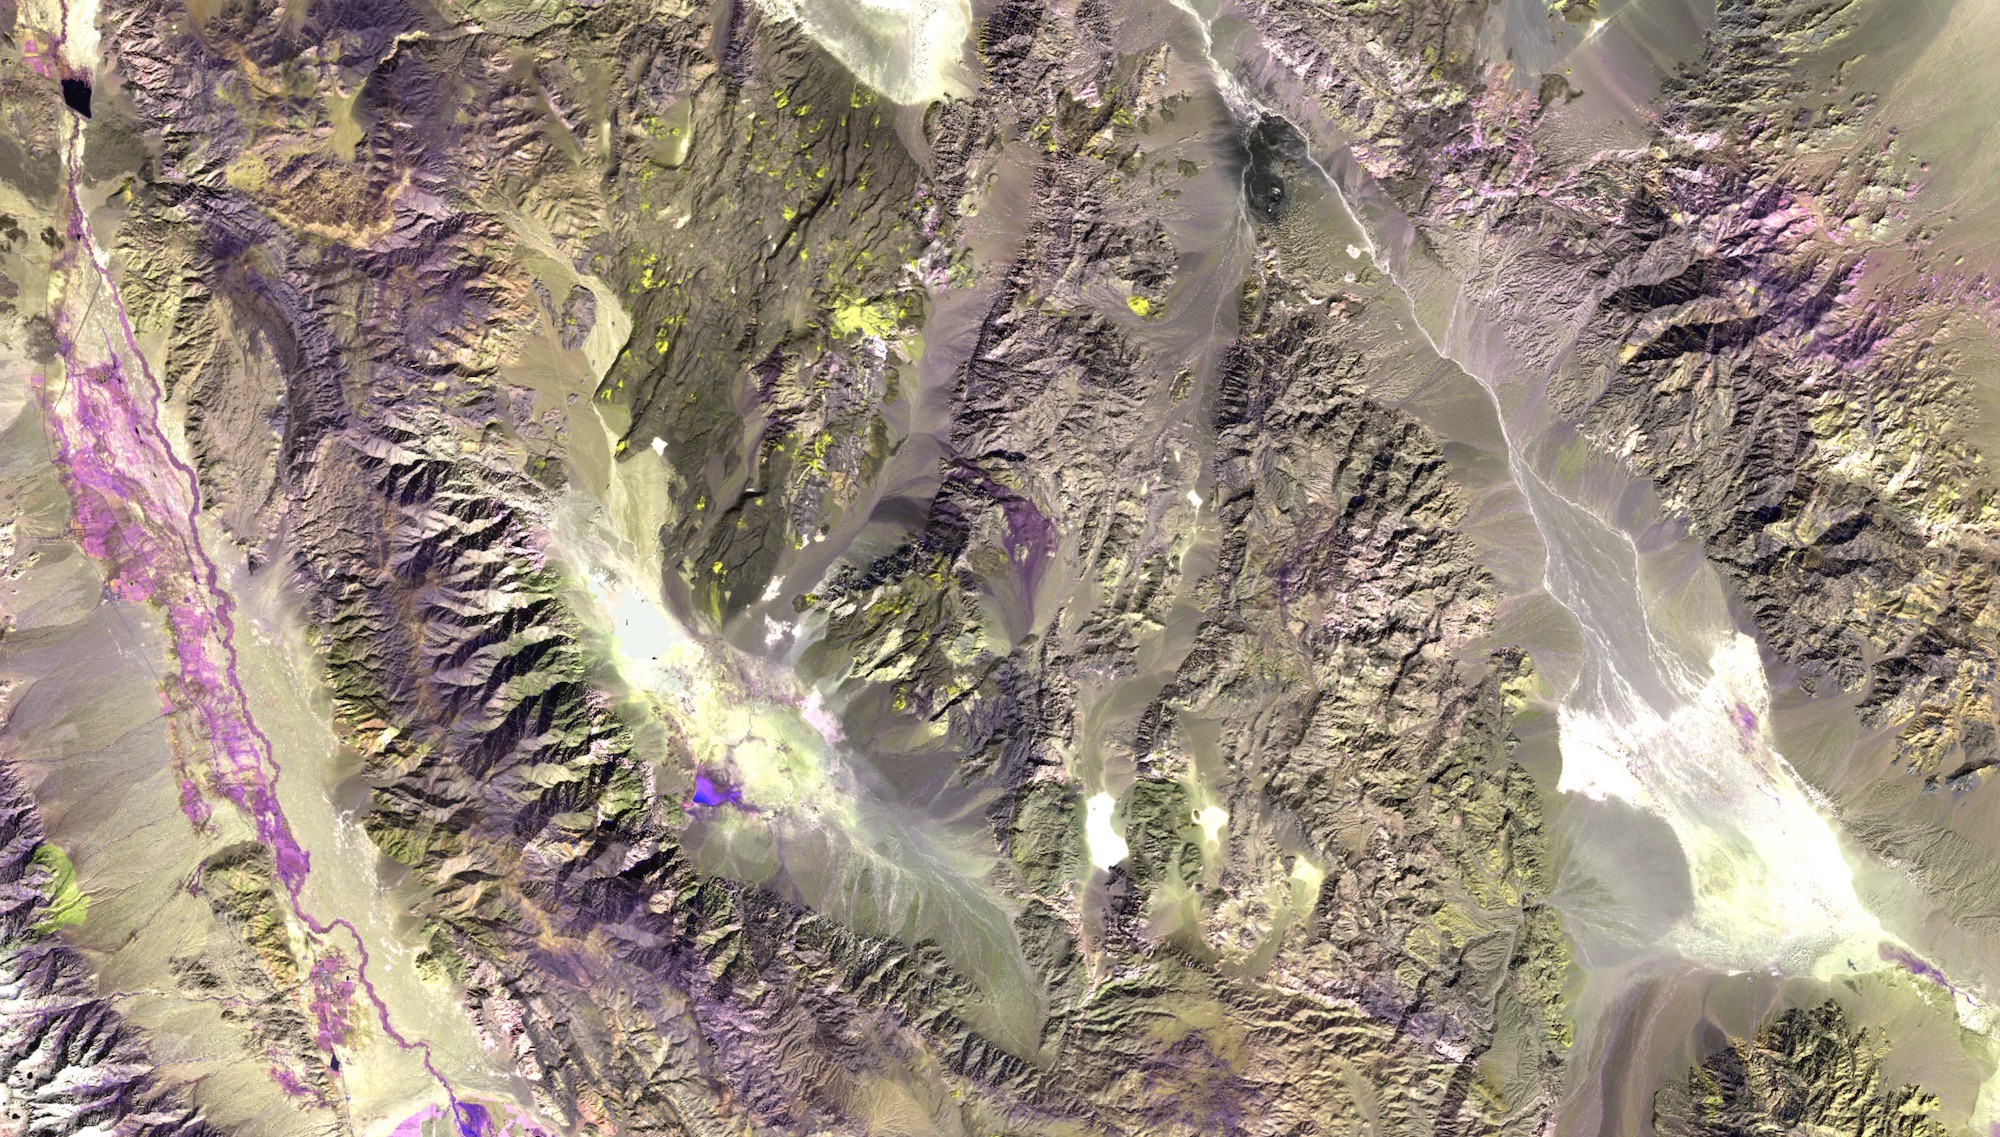
 Figure 2: Sub-areas from the southern parts of each of the western (L) and eastern (R) centers are shown for each of EnMAP data (top), and SpecTIR data (bottom) datasets, clearly showing differentiation at the mineral species level., with much more detail mapped with SpecTIR than EnMAP with its higher spatial resolution. These areas contain much of the hydrothermal and geothermal alteration from spectral references sites F thru L & S thru V from Figure 3. The position of these spectral reference sites (O) are visible in each view.
The spectral results presented here are those from within the southern part of the two alteration centers shown in Figure 2, containing mostly hydrothermal or geothermal, or advanced argillic and argillc, alteration. Collection locations of spectral samples and signatures from Swayze et al. (2014) were carefully positioned in Marigold, and (in-scene) spectral signatures were derived from each of the EnMAP and SpecTIR datasets for each of the reference locations.
Figure 5 presents a comparison of spectral signatures from Cuprite from each of the EnMAP and SpecTIR and datasets for each of the Alunite members identified over the area along with the spectral signature collected by Swayze et al. (2014). The first plot is for K-Alunite-1 (7F), a species which forms at a higher temperature. The shape of the main absorption feature at 2170 nm for this plot is quite consistent for all three spectra, although the depth of the feature is more significant for the Cuprite reference sample than for either the EnMAP or SpecTIR signatures. The shape and position of secondary absorption features at 2220 & 2320 nm associated with the alunite are very consistent. There are a few additional ‘noisy’ features in the EnMAP data at ~2000 nm which are present in almost all of the EnMAP spectra collected, which is likely residual from the atmospheric correction and conversion of the data to surface reflectance; these spectral positions were not included in spectral mapping presented later in this study
 Figure 3: Subset of Mineral Mapping Results over Cuprite Western and Eastern alteration centers for clays, micas, sulfates and carbonates using Tetracorder (from Swayze et al., 2014).
The second alunite sample (K-Alunite-2 - 8G) is also K-rich, but it was identified in the eastern center, and is reported to have formed at a more moderate temperature. In this case, the depth of the main alunite absorption is much more significant for the ground truth spectra than that for either EnMAP or SpecTIR data, although the position and relative size of each of the secondary absorptions are again consistent. The shape of the signature for these two sensor spectra are very close, with the EnMAP signature marginally noisier than that from SpecTIR.
 Figure 4: Reference image (RGB) commonly used to highlight hydrothermal alteration created using the SpecTIR HSI data over Cuprite (SpecTIR AST641eq product), illustrating the position of ground truth spectral reference sites from Swayze et al. (2014), which were examined for this investigation.
The same pattern is reflected in the spectra from the third alunite mineral species, which is Na, K and Ca-rich, that is reported to form at lower temperature (Swayze et al., 2014). In this case once again, the depth of the main absorption for the ground truth reference spectra is the larger than that for the EnMAP and SpecTIR spectra, and the shape and position of secondary absorptions for the EnMAP and SpecTIR features are similar, with the EnMAP data marginally noisier than that from SpecTIR. Overall, all of these surface exposures are relatively large and mapping results from Swayze et al. (2014) can be readily viewed in the map in Figure 3.
A selection of more unusual minerals with smaller surface exposures were also identified for assessment in this study. This includes dickite (14L), buddingtonite (11I) and halloysite (15P). The spectral signatures for each of these minerals was also derived for each of the EnMAP and SpecTIR datasets at each of the Swayze et al. (2014) spectral reference locations identified in Figure 4. These in-scene derived spectra are shown for assessment in Figure 6.
 Figure 5: Comparison of in-scene spectral signatures (over the SWIR) for each of the different Alunite endmembers identified over Cuprite for EnMAP and SpecTIR HSI data against reference spectral signatures from ground truthing from Swayze et al. (2014).
The dickite spectral signature for location 14L has the distinctive nearly equal depth doublet around at about 2180 and 2207 nm, and although this signature looks slightly different for the SpecTIR signature (not as deep for the left absorption), the distance of these two spectral absorptions are both characteristic for dickite. The spectral signature for the EnMAP data however is characterized by a doublet with the left absorption significantly smaller at 2174 nm, and the right absorption at 2208 nm. The left absorption is not shifted so far that it could be interpreted as kaolinite, but based on it’s position it could be a mixture of dickite and kaolinite, or even halloysite; a mixture of minerals were reported for the location, and spatial mixing would be normal for a 30 m pixel.
Spectral signatures were also collected for buddingtonite (NH4 analogue of K-feldspar) (11I), as well as site (15P) a location reported to have a mixture of minerals, but with significant halloysite. These derived in-scene signatures are also shown in Figure 6. The spectral signature for all of the (11I) spectra don’t match the spectral library signature for buddingtonite, but have sort of a flattened doublet shape; the same result was reported by Swayze et al. (2014). Apparently the buddingtonite at this locality is highly mixed with Na-montmorillonite. The signature for the EnMAP spectra is even more flattened over the left absorption, and really only shows a weak absorption at 2208 nm, mostly indicative of Na-montmorillonite; this is likely the result of spatial mixing with the larger pixels for this data. The reference signature for site (15P), is characteristic of halloysite, with the main absorption at 2208 nm and a ‘shoulder’ secondary absorption at ~2165 nm.
The in-scene spectral for EnMAP is similar although slightly flattened, likely due to spatial mixing again. Interestingly enough, the in-scene derived spectra for the SpecTIR data for (15P) is dominated by the 2208 nm absorption, with little to no shoulder. Validation of a number of adjacent pixels shows that there is quite a bit of variability compositionally at this site, so it is possible that the issue is more of positional error in the position of the reference site for this location (selecting the correct 1 mi pixel); or that the reference signature was collected on a smaller sample or more spectrally unique sample that isn’t spectrally an average of the spectral features at that location. As is indicated in Figure 6, this location has many minerals present, namely kaolinite, white mica, alunite and halloysite, so spectral diversity should not be a big surprise.
 Figure 6: Comparison of in-scene spectral signatures (over the SWIR) for different mineral species endmembers (dickite, buddingtonite and halloysite - L to R) identified over Cuprite for EnMAP and SpecTIR HSI data against reference spectral signatures from ground truthing (Swayze et al., 2014).
In-scene spectral signatures were collected for a suite of minerals from the Swayze et al. (2014) ground truth reference locations over Cuprite, and the mineral mapping results for a selection of these species, will be shown here. For consistency, the same supervised classification algorithm, Spectral Angle Mapper (SAM) was used for all mapping results. Spectral Angle Mapper (SAM) is a supervised classification technique that uses the angle between the endmember spectrum vector and each pixel vector in n-dimensional space to map the spectral similarity between a selected spectral signature and each pixel in the imagery.
Successful mapping with hyperspectral data is often very dependent on the ability to differentiate endmembers from the data. Comparing SAM outputs between the EnMAP and SpecTIR datasets for the different alunite mineral species, or endmembers, from Cuprite (Figure 7), shows much more accuracy and detailed mapping from the SpecTIR data, representing a significant improvement in classifying areas for each of the different alunites as a function of their spatial resolution. Although the pixels, and hence the mapping, for EnMAP is coarser (30 m), it is nonetheless still very possible to differentiate and map areas of different alunite species with good correspondence to the ground truth-derived mapping (from Figure 3), which is surprising.
The ability to differentiate detailed compositions so accurately here is believed to be due largely to the extensive exposures of these different and distinct alteration species and their mixtures at Cuprite. It might be much more challenging to map mineral species so effectively at other locations, or with other deposit types, as large outcrops or exposures of spectrally distinct minerals are rare, and spatial mixing with 30 m pixels may become significant and make it hard to identify spectral endmembers.
 Figure 7: SAM Mineral mapping results shown here were derived from in-scene endmembers drawn from EnMAP (top) and SpecTIR (bottom) HSI for Alunite (7F, 8G, 9H reference locations from L to R), and can be compared to mineral mapping of these same mineral species by Swayze et al. (2014) in Figure 3.
Spectral mapping data can also be examined to assess compositional variability, which is typically done via examination of changes in composition which may be related to temperature of formation or mineral crystallinity. In many ore deposits such relationships can be used and interpreted to identify vectors to mineralization, which will help significantly for mineral exploration targeting in both field and drilling operations. Here the three different Alunite species were combined in an RGB Ternary Plot (or TRatio), to provide a visual representation of hotter to cooler temperatures of formation (Figure 8). The K-Alunite-1 sample (7F) was identified to have formed under hotter temperatures and was mapped as red, K-Alunite-2 (8G), was identified to have formed under more moderate temperatures and was mapped as green, and Na-K+Ca-Alunite (9H) was identified to have formed under lower relative temperatures and was mapped as blue (Figure 8). The image is dominated by a pinkish-red in the ring of topographically prominent outcrop at each of the western and eastern alteration centers where the relative abundance of the higher temperature K-rich alunite is higher (based on mapping from Figure 7). The surrounding ground is mostly green to purple in color in the image, reflecting a mixture of 7F to 8H alunite (green) or 7F and (9H) alunite (purple), which can be interpreted from the legend. According to exploration reports to-date, significant mineralization has not been identified at Cuprite, so the relationship here effectively maps temperature of formation rather than vectoring to mineralization.
As mentioned previously, the size of the exposure or outcrop of a specific mineral, relative to the size of the pixel for a hyperspectral sensor, as well as the degree of spatial mixing of that mineral species relative to other minerals found at that location, will control the ability to map the presence of that mineral by that sensor. To assess the impact of spatial mixing with the EnMAP sensor, some of the smallest exposures at Cuprite were selected for mapping with both of the dataset EnMAP and SpecTIR, namely that for dickite (14L), buddingtonite (11I) and halloysite (15P). Halloysite, in particular, will be challenging as it is reported as one of a mixture of minerals (kaolinite, white mica and alunite) at this location. Mineral mapping results for these minerals are shown in Figure 9.
Compositional mapping results for each of these assessments was highly thresholded in an effort to be able to assess whether a specific mapping result is able to highlight the known specific locations or outcrops for these minerals with a strong relative abundance mapping result (which would show up as dark red in the ‘jet’ color table used). For this mapping, red represents high relative abundance trending through yellow to green to blue, with the latter being of lower relative abundance (Figure 9). The well known locality for dickite is ‘Dickite Ridge’, shown at the (14L) spectral position in each of the EnMAP and SpecTIR mapping results. Even at a spatial resolution of 30 m, it is possible to spectrally map this composition and feature from the EnMAP data, which is really significant as it means that the unique spectral signatures of dickite can be differentiated and mapped from this regional-scale data, as well as in areas around Dickite Ridge interpreted with lesser proportions in a pixel mapping using sub-pixel unmixing.
Outside of Dickite Ridge, the mapping is likely also mapping spectral features not associated with dickite. A comparison of EnMAP and SpecTIR mapping results shows that the SpecTIR data has more discrimination with respect to higher relative abundances mapped to a pixel, which is to be expected. Overall, however, the pixels selected and the pattern of mapping for dickite are quite consistent between the two datasets.
 Figure 8: RGB Ternary plot from SpecTIR data for samples in reference to their temperature of formation (R: 7F-Alunite-1 High Temp, G: 8G-K-Alunite-2 Med Temp, B: 9H-Na-K+Ca-Alunite, Low Temp).
The mapping results for buddingtonite are quite different from those for dickite (Figure 9). As mentioned previously, in-scene spectral signatures from each of EnMAP and SpecTIR were derived from the data at the Swayze et al. (2014) spectral reference site (11I). The fact that the input in-scene signatures are a mixture of buddingtonite and Na-rich montmorillonite is reflected in the mapping results themselves. The EnMAP sensor does map the position of the ‘Buddingtonite Bump’, but it also significantly maps the Na-rich montmorillonite from the signature over the Stonewell Playa, which is known to be Na-montmorillonite in composition (16Q; Figure 3).
Mapping of buddingtonite is more accurate compositionally from the SpecTIR data, which would be expected with a pixel resolution of 1 m. The SpecTIR data also mapped quite a few individual pixels and clusters over the western alteration center, which could be localities where buddingtonite is also present - this would take ground truthing to check as the degree of mapping from Figure 3 does not allow for that interpretation.
 Figure 9: Mineral mapping results (SAM, with a jet color table) were computed from in-scene endmembers drawn from EnMAP (top) and SpecTIR HSI data (bottom) for select minerals (dickite - 14L; buddingtonite-11I; halloysite - 15P). Each of these localities have characteristic outcrops, as identified here, and compositional mineral mapping of these same mineral species can be compared to that published by Swayze et al. (2014) in Figure 3.
The last mapping result shown in Figure 9 is that at (15P), which is a mixture of kaolinite, white mica, +/- alunite or halloysite. The spectral signature from the USGS reference in Swayze et al. (2014) corresponds highly to that of halloysite, so despite the reported presence of the other minerals, it was determined that in-scene spectral signatures from (15P) for each of EnMAP and SpecTIR would potentially still provide valuable spectral mapping information. A comparison of the mapping results for each sensor from Figure 9 supports this assessment. Although the detail of the mapping is much more significant in terms of which pixels map darker red in color (higher relative abundance), the overall pattern of mapping is quite consistent between the two datasets.
The only locations where this is not true, is for the alluvial fans eroding off the topographic highs from the eastern center, where the mapping of halloysite relative abundance becomes more continuous with splotches of color suggesting more spectral continuity, almost surely due to spatial mixing of materials within the fans. However, the known outcrop of halloysite at (15P) is clearly and consistently mapped by both sensors, showing a high degree of mapping accuracy from both sensors, and more significantly by EnMAP because of the larger, regional-scale size of the pixels at 30 m.
Overall, this investigation has clearly shown that despite having a spatial resolution of 30 m, if the size of the exposure of a feature is large enough, and the proportion of the mineral is significant enough within that exposure, then regional-scale spaceborne hyperspectral data can be effectively used for mineral species-level exploration mapping and targeting. The questions then become: what are the limits, when will it work, and when will it fail? How large must the outcrop or alteration exposure be to be mapped, and what proportion of a pixel must be dominated by that mineral in order to be mappable, even with sub-pixel unmixing?
Furthermore, how significant is the distinctness of the spectral signature itself on the potential success of the mapping or, specifically what do the characteristics of the spectral absorption features need to be for mapping to be successful? Lastly, what processing choices need to be made to maximize the ability to do this mapping from an algorithm, processing method and restrictive input spectral wavelength selection perspective?
For this study, we were able to collect insights on the size of the exposure that it was possible to map using the different imagery. For example, Dickite Ridge (14L), from a topographic/spectrally coherent perspective is ~225 m long, but only about 30 m wide, therefore about 7.5 pixels long but only a pixel wide on average with EnMAP data. It therefore comprises only about 8 pixels in size in EnMAP data, but 6750 pixels with SpecTIR data. However, when you zoom out and interrogate the area from more of a spectral differentiation perspective, you see that it is really quite a spectrally unique feature that is much bigger than the ridge itself, at ~100 m wide and ~400 m long, and compositionally similar within this size as well. Spectral validation shows that this feature has coherent spectral features as well, which is showing up in multiple products when investigated (Figure 10). As a result, it is not a surprise that this is a mappable feature, even using regional scale hyperspectral data.
 Figure 10: A view of the SpecTIR PCA123 (L) and an EnMAP AST641eq product (R) over Dickite Ridge (14L), highlighting compositional coherence in the spectra over this feature, as well as showing visually the uniqueness of this feature compared to surrounding pixels, even with regional-scale data (EnMAP).
The ‘Buddingtonite Bump’ feature is the second feature that was investigated in detail in this study. It was found to be ~115 m wide and ~155 m in length, comprising about 4 pixels wide and 5 pixels long with EnMAP data and thousands of pixels with the SpecTIR data. An interrogation using the SpecTIR data identifies the unique 2115 nm/2145 nm doublet associated with buddingtonite at the spectral reference position (11I), and although there is compositional variation over the feature, the 2115 nm feature is still visible in the pixels for this feature (Figure 11). What does this mean in terms of compositional differentiation and mapping? We know from the mineral mapping tests that this feature was mapped using the SpecTIR derived signature in the mapping at 1 m resolution, but overall the in-scene spectral composition derived from the EnMAP dataset was insufficient to support accurate mapping at the regional-scale, and this is also reflected visually with lack of compositional coherence in the EnMAP data over the feature location (Figure 11).
 Figure 11: A view of the SpecTIR PCA123 (L) and an EnMAP AST641eq product (R) over the Buddingtonite Bump (11I), highlighting the compositional variability in the spectra over this feature in the SpecTIR data. This compositional variability is reflected in poor spatial coherence and mapping results for this feature using in-scene derived spectra from the EnMAP data at the regional-scale (R).
The third site examined from a mapping perspective was spectral reference site (15P), which contains a mixture of minerals, namely kaolinite, white mica, alunite and halloysite. An investigation of the site spectrally using the SpecTIR data showed that the (15P) spectral reference position contained a distinctive absorptions for halloysite (2213 nm), with a very small shoulder. These were found to be present on spectral ‘ridges’ that extended northeast to southwest across a ‘boot-shaped’ feature over the area (Figure 12). The size of this overall feature was measured at ~260 m in length, and ranged from 75 to 125 m in width. These dimensions comprised ~9 pixels in length and ~2-4 pixels in width in the EnMAP data. We know from the mapping results from Figure 9 that overall the composition from the EnMAP in-scene spectral signature for the location was quite successful in mapping across the study area, and compared well to the mapping from the higher spatial resolution SpecTIR data. This is also reflected in some of the products investigated, namely unique spectral features mapped in a custom AST641eq product from the EnMAP data over the locality (Figure 12).
There is more work to be done to provide answers on predicting when it will be possible to successfully use regional scale HSI data like EnMAP for mineral species compositional mapping. The size of the outcrop is a significant factor, but so is possession of an accurate spectral signature for the mineral species (endmember) or significant suite of alteration that you would like to map, even as a mixture. Furthermore, mixtures of mineral or alteration suite endmembers with other surface features like vegetation will make this much more challenging.
As a remote sensing student, we were always taught that it was possible to undertake subpixel mixing if the composition you wanted to map comprised at least one third of a pixel (P. Hauff, pers. comm.), but you need to identify the spectral signature of the endmember to do the unmixing, so you have to figure out what this composition is first, either from within the scene, through ground truthing or via the use of appropriate spectral library signatures.
 Figure 12: A view of the SpecTIR PCA123 (L) and an EnMAP AST641eq product (R) over the (15P) spectral reference site, which contains kaolinite-white mica-alunite and halloysite. (11I). The SpecTIR data highlights the spectral characteristics of the halloysite + at the reference site (cyan dot), preferentially over the spectral ridges. An examination over the area with a custom view of the AST641eq product shows that there is some consistency in the composition of this site, despite its small size, which likely leads to the mapping success even using the EnMAP regional-scale data in Figure 9.
This investigation has shown that despite having a spatial resolution of 30 m, if the size of the exposure of a feature is large enough, and the proportion of the mineral or alteration mineral suite is significant enough within that exposure, then regional-scale spaceborne hyperspectral data like EnMAP can be effectively used for mineral species-level exploration mapping and targeting. The key question is: can you differentiate the spectral composition from one or more pixels, and is it distinct enough to be unmixed and mapped compositionally over the target area?
It is much easier to map a feature visually and compositionally using all of your remote sensing skills and determination when you know it is there. It is quite another challenge to find those elusive distinctive endmember signatures in data when you neither know where it is, nor its unique spectral composition. The solution becomes iterative: chasing compositional trends in known mineral-rich deposit areas, the use of effective ground truthing; mapping to understand what the ‘sensor sees’, and careful and judicious use of spectral signatures from appropriate sources, along with other unmixing and spectral mapping tools and solutions to understand the compositional variability of your study area. Our industry is looking forward to seeing what is generated by these new data sources in the future!
![]() Please reach out if you would like more information on how hyperspectral remote sensing could benefit your exploration workflows. The more data and deposits you look at, the better your skills get and features such as an interface with access to global data, and online processing with lightning fast supercomputer processing capabilities make a ‘world’ of difference.
Please reach out if you would like more information on how hyperspectral remote sensing could benefit your exploration workflows. The more data and deposits you look at, the better your skills get and features such as an interface with access to global data, and online processing with lightning fast supercomputer processing capabilities make a ‘world’ of difference.
All mapping outputs shown here were generated on Descartes Labs’ Marigold software using our latest hyperspectral tools.
Thanks are extended to SpecTIR for sharing a copy of their AISA FENIX high resolution airborne hyperspectral data over Cuprite, and further for making this available to Descartes Labs customers for training purposes. If you would like to access more high quality airborne hyperspectral data like this, check out SpecTIR's spectral atlas. Thanks are also extended to the German Aerospace Center (DLR) for building EnMAP and also for making this data available publicly for both training and commercial reasons. Access to this type of data will fundamentally influence the advancement in the use and understanding of the capabilities, and benefits of hyperspectral data in all subject areas associated with compositional mapping of the surface cover types of the Earth. Thank you from remote sensors everywhere.