Article category: Mining, Science & Technology
Sentinel-1 Technical Series Part 2 | SAR Geocoding: Working...
In this post, we will describe Descartes Labs' SAR geocoding approach, which powers our global...
This is Part 5 of a technical series focusing on Descartes Labs’ global SAR processing capabilities. SAR provides a valuable remote sensing tool, and this series will dive into detail about how we process SAR data globally and build SAR and InSAR-derived products. Prior articles in this series can be found here: Overview, Part 1, Part 2, Part 3, and Part 4.
In part 5 of this series we will use Sentinel-1 to look more closely at one of the AOIs we looked at in part 4. The goal is to demonstrate what results are possible with Sentinel-1-based InSAR.
As with Part 4 of this series, we will be measuring deformation. In this case we will look at a region identified in Part 4 around the Antelope Valley Freeway in Santa Clarita. In particular we will provide a time resolved deformation history at a higher resolution.
The InSAR methods used here are more complicated than those used in Part 4 and are described in detail in Sec. 2 of (1). The high level summary of the method is as follows:
With the exception of step 5 above, the methods we use are from the open literature.
Note that lots of large structures move at a scale that can be measured by InSAR. Further, motion does not always indicate a problem. Finally, while InSAR can provide a valuable signal, InSAR cannot replace expertise in assessing risk.
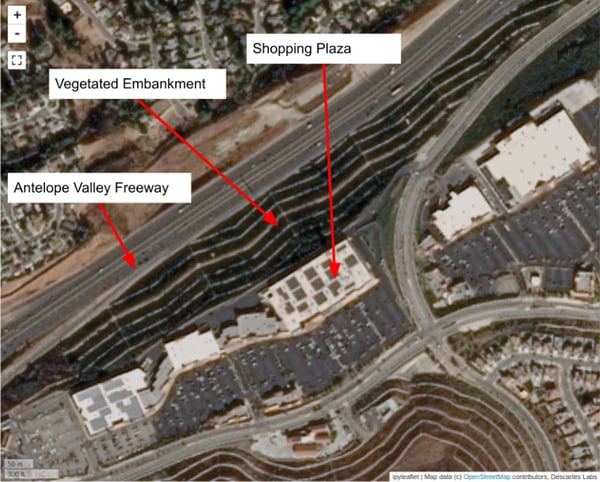
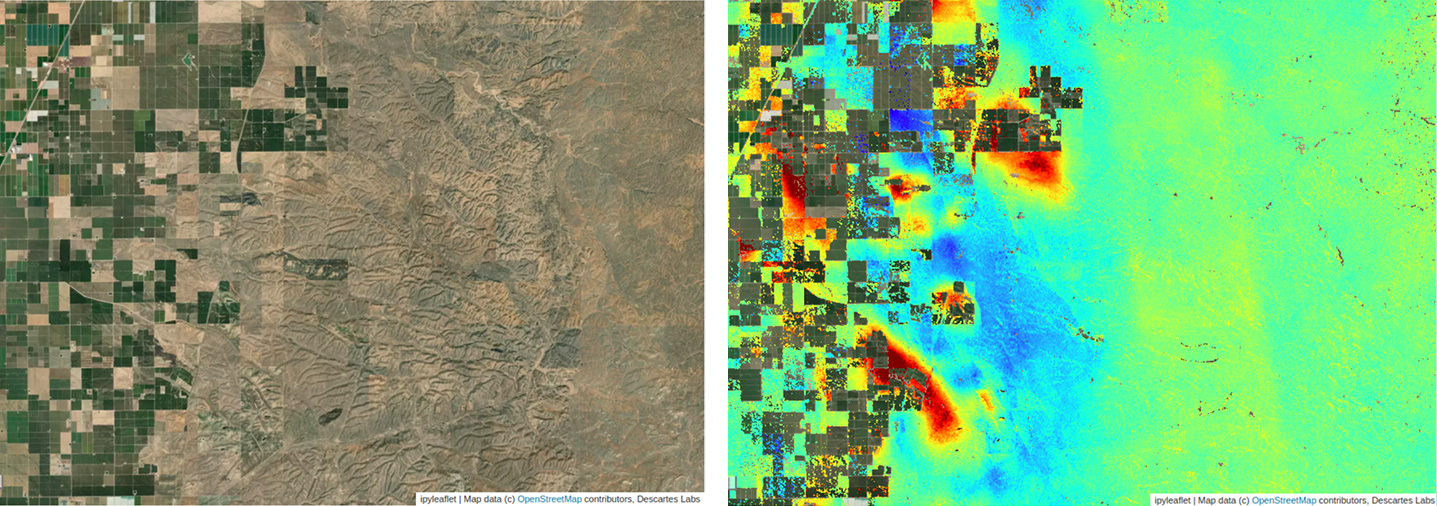
Above we see optical imagery of the area of interest (AOI), at roughly a lat, lon of 34.3952, -118.4652. The Antelope Valley Freeway is down a vegetated embankment from a shopping plaza.
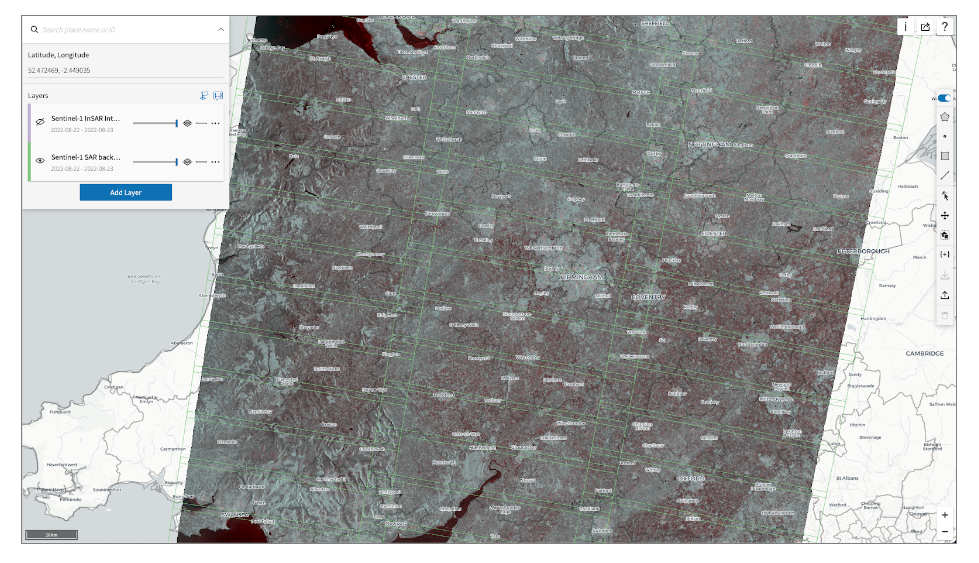
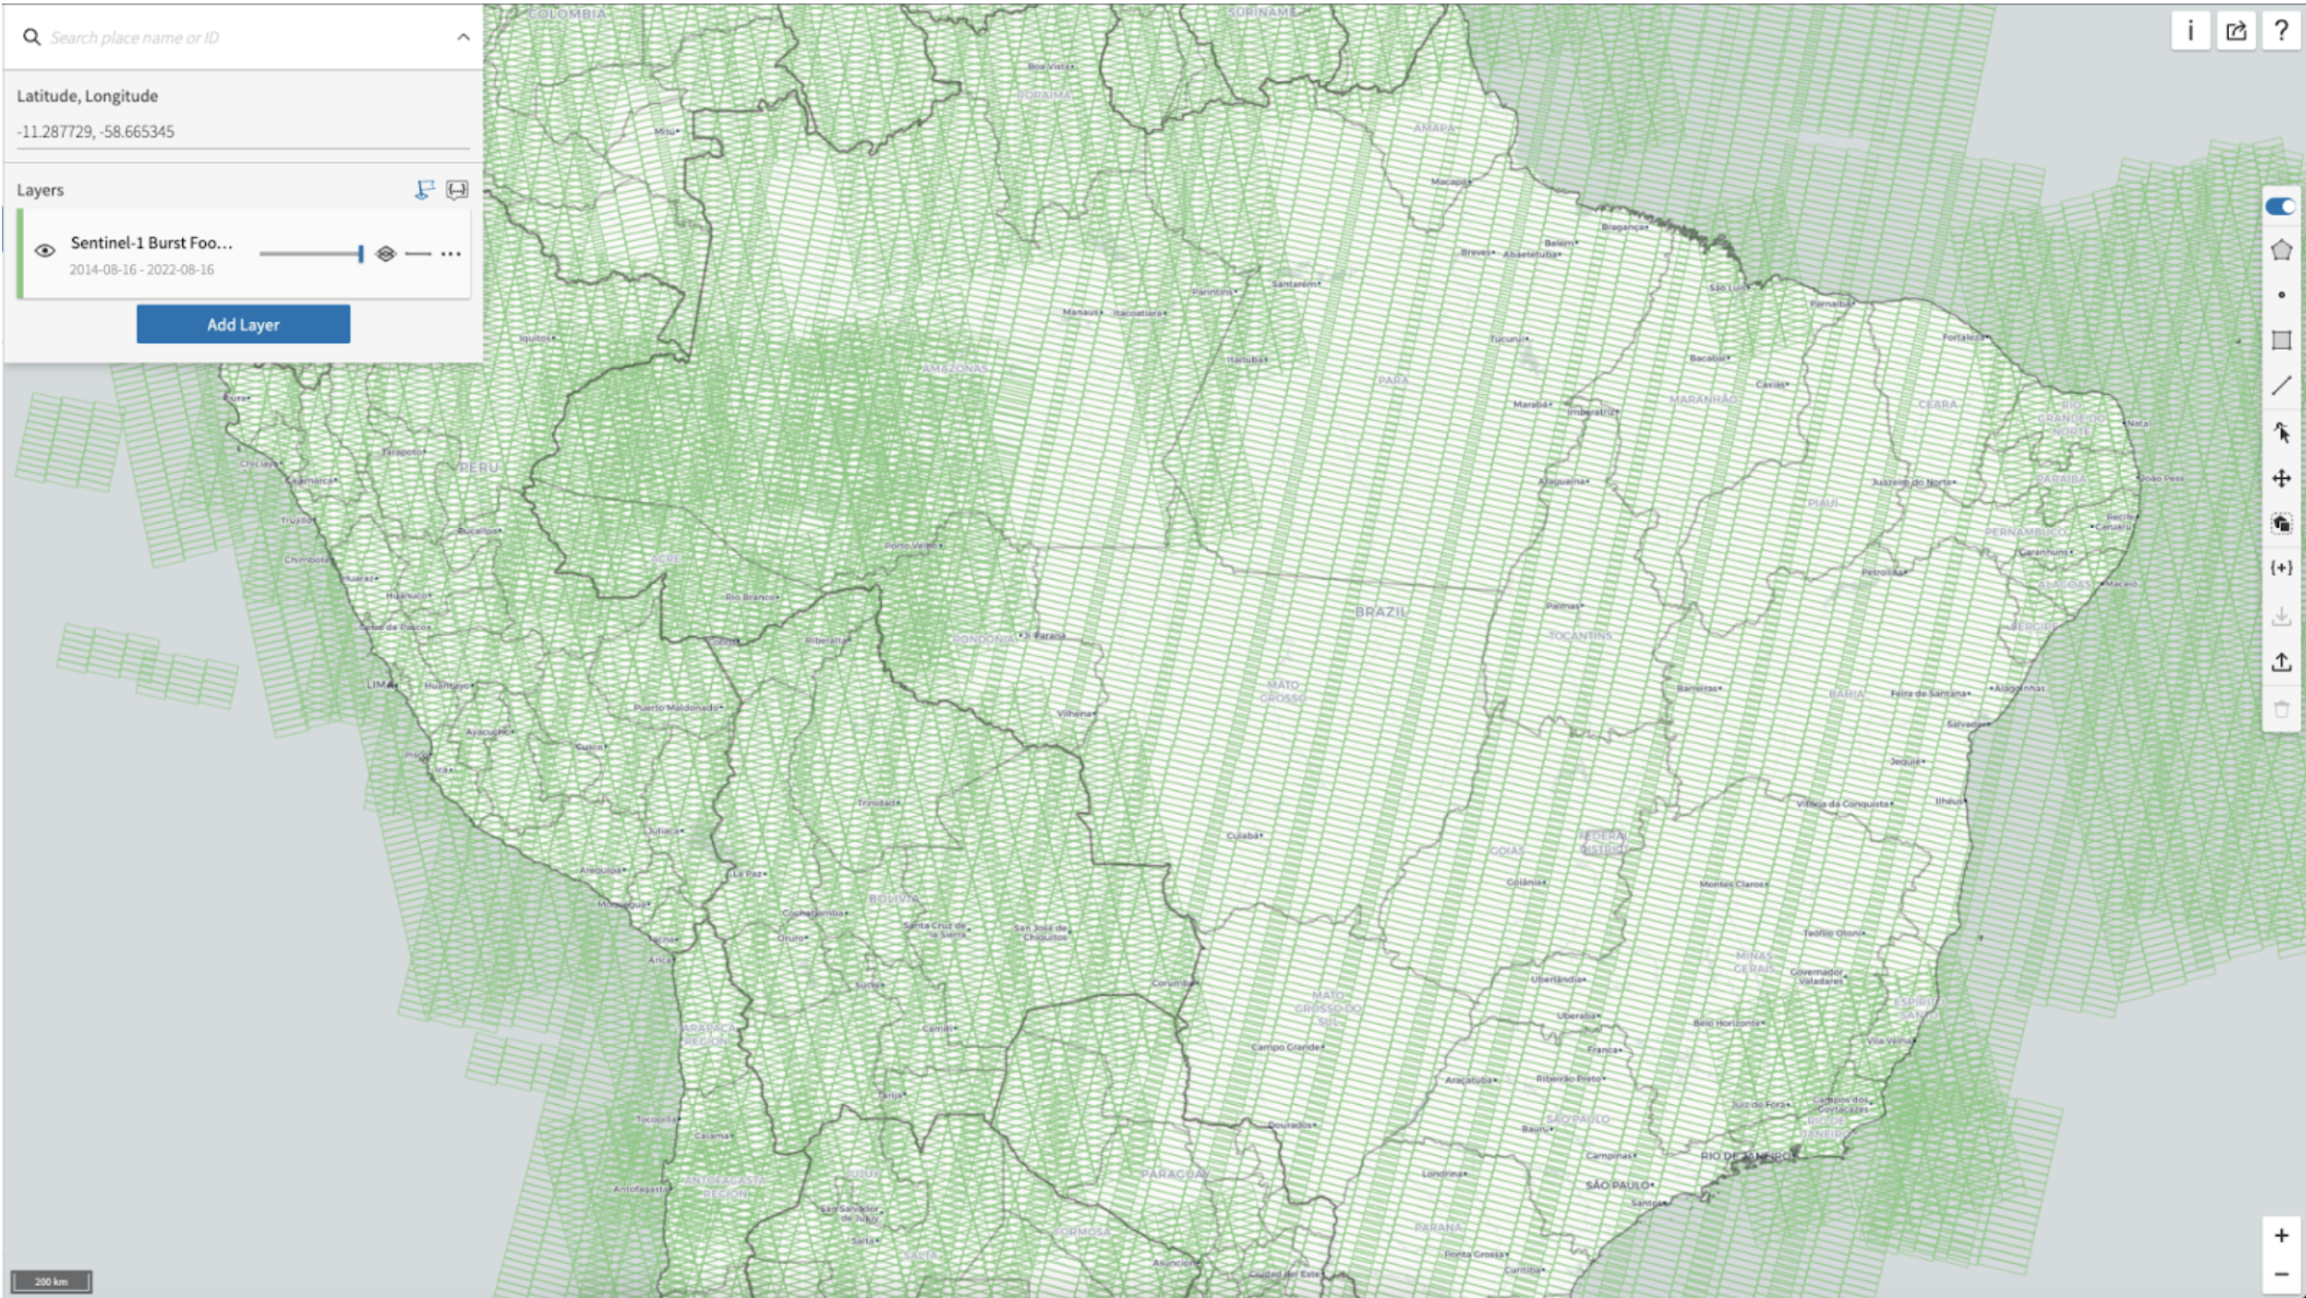
During the year 2021, this AOI was imaged repeatedly by four different Sentinel-1 orbital tracks. The burst footprints associated with those images are:
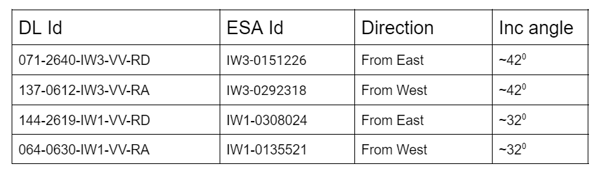
For each footprint we have a stack of roughly 60 complex SAR images for each of the footprints above.
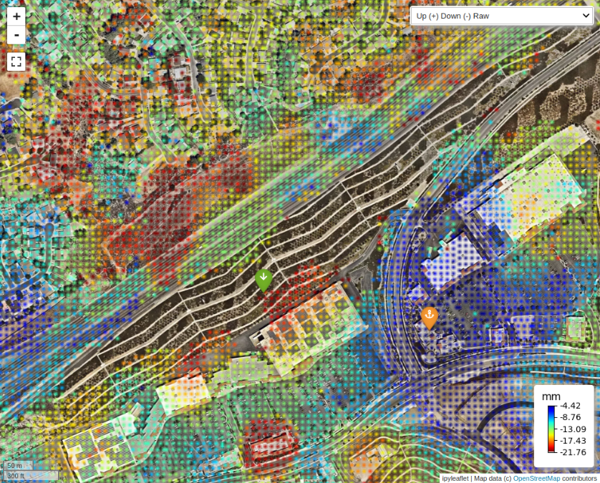
Above we show the point cloud of good pixels, color-coded by the cumulative deformation during the year 2021. This is derived from stack 1 of SAR imagery. The orange “anchor” point is our reference, and all deformation is reported relative to it. Note that these data have not been filtered or smoothed. Such smoothing would be applied in a production setting.
Note that the vegetation along the embankment reduces the quality of the phase measurement, and we do not have as many pixels as we did in the global analysis reported in Part 4. Note also that the global analysis reported results at a 20m posting. Here we have data at 10m posting.
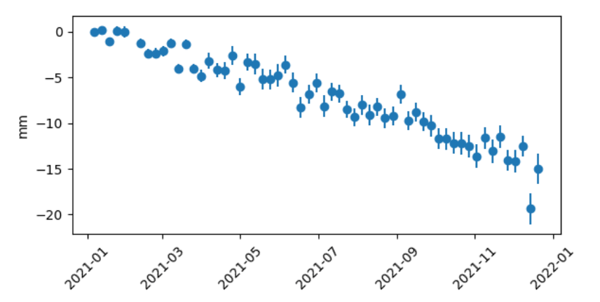
Above we show the time history of deformation at the green marker relative to the orange marker. The error bars are the standard deviation of the results from our ensemble study. We can use these uncertainty estimates to filter out points where the spread in ensemble results suggests high uncertainty. Variations from the linear trend in excess of the error bars are likely due to transient atmospheric effects.
Because each stack of imagery was collected from a different point in the sky, and because we are reporting deformation along the line-of-sight (LOS), results from the four stacks are similar, but not immediately comparable.
We can address this as follows: Given deformation results collected from ascending passes (imaging from the west) and deformation results collected from descending passes (imaging from the east) we can infer the vertical motion that is consistent with the two sets of deformation results. As a consistency check, we merge results from stacks one and two to get a vertical deformation history, and we merge results from stacks three and four to get a second vertical deformation history.
Above we show the points from the first vertical deformation analysis, color coded by cumulative deformation during 2021.
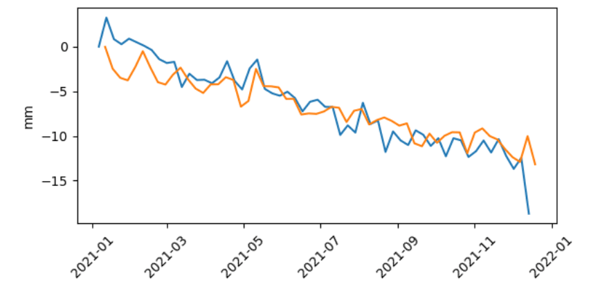
Above we see the deformation history of the green point relative to the orange point for the first merged analysis (blue line) and the second merged analysis (orange line). InSAR, like any measurement technique, can have errors. However, the analyses reported here are from independent stacks of SAR imagery, suggesting that this measurement is independent of look angle.
These analyses of this AOI took less than a day with the Descartes Labs scalable compute and Sentinel-1 processing pipelines, and could easily be deployed as persistent analyses that are automatically updated with each new Sentinel-1 collection.
The Descartes Labs approach combines automated Sentinel-1 satellite ingest, monitoring, and measurement using our world-leading InSAR product. The product is updated globally every 12 days and a fully transparent analysis is delivered less than 24 hours from data collection.
Our industry-leading data pipelines and automated preprocessing capabilities allow for rapid prototyping and provide a scalable solution to monitor all assets consistently. Customers are alerted to deformation events quickly, giving them the opportunity to address more serious infrastructure degradations before they occur.
Contact our team to discuss how we can integrate our global SAR and InSAR product into your processes to enable deformation analysis.
References: